- Home
- Publications and statistics
- Publications
- The labour share in value added: a compl...
Post n°65. Changes in the value added sharing are the focus of considerable debate. In France, the assessment depends largely on the scope of analysis chosen and the degree to which it is aggregated, and it differs depending on the sector: since the crisis, the labour share has increased in market services but has declined in industry.

Source: Insee, authors’ calculations
The gross value added (including consumption of fixed capital) sharing between labour compensation and gross return on capital has been extensively discussed in the literature. It has become broadly accepted that since the 1980s this sharing has been distorted at the expense of labour in the vast majority of the most advanced economies but also in a large number of emerging countries (see for example IMF, 2017 ; Chi Dao et al., 2017). As the share of income from capital increases with household revenues, this distortion is believed to be the cause of widening income inequalities.
A variety of reasons have been proposed in the literature to explain how the sharing of overall income has been distorted in favour of capital. The most frequently mentioned include: (i) the effects of technological advances and the lower price of investment goods, on condition that the elasticity of substitution between capital and labour exceeds unity (Karabarbounis and Neiman, 2014) or because, in a "winner takes all" logic, digital economy firms can generate significant rents (Autor et al., 2017); (ii) globalisation, via different channels, including the weakening of the wage bargaining power of workers forced to compete with each other (Elsby et al., 2013); (iii) the introduction of labour market reforms, which also weakens the bargaining power of workers in the sharing of rents (in keeping with the model of Blanchard and Giavazzi, 2003, which is confirmed by Askénazy et al., 2018).
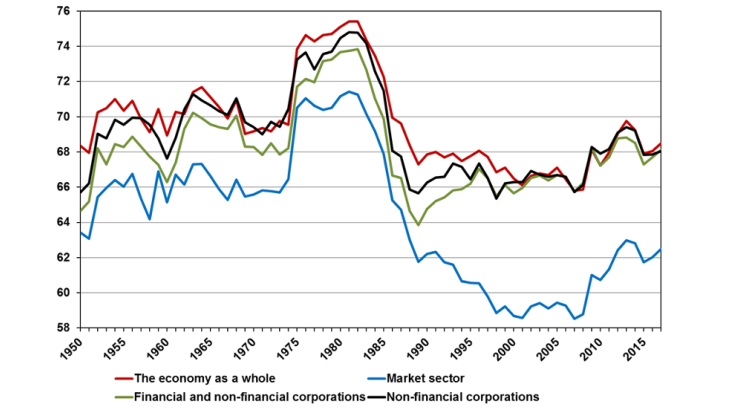
Drawing on data for France shows that the overall assessment of the changes in the gross value added sharing depends largely on the scope chosen to construct the indicator and the degree to which it is aggregated (see Chart 1).
Here, we apply the analysis provided by Askénazy et al. (2012), with a sharing of value added measured on gross data and at factor cost so that the share of labour is the complement to 100 of the share of profit, in other words the margin rate. Labour compensation here includes salaries, social security contributions and taxes on payroll costs. Gross operating profit (profit) takes into account income from capital (interest and dividends), corporate income tax and gross saving.
For the economy as a whole, the share of labour declines by approximately two percentage points over the two decades from 1988 to 2008, then climbs by almost four percentage points during the crisis before dropping by around two percentage points in recent years (see Chart 1). This global scope incorporates non-market GDP, which accounts for more than a quarter of the total, and whose calculation is dictated by strict international accounting conventions. For the market sector scope alone, the trends are qualitatively similar even if they differ slightly from a quantitative point of view after 2008: the decline in the labour share in recent years only amounts to around half a percentage point. However, the market sector includes self-employed workers, whose income – mixed – includes a salary equivalent that compensates their activities and a profit equivalent that provides a return on their advance of capital. The above calculations of the labour share assume an equivalent salary for each self-employed worker equal to average labour compensation.
For corporations as a whole, which excludes self-employment in French national accounting, the change in the value added sharing is different: the share of labour increases by approximately two percentage points over the 1988 to 2008 period, then climbs a further three percentage points during the crisis before dropping to a level that remains higher than that observed prior to the crisis. However, assessing the value added of financial corporations also depends on the international accounting conventions that influence the analysis. The non-financial corporation (NFCs) scope has the greatest statistical precision and is least influenced by accounting conventions, but only covers around half of French GDP. From 1988 to 2008, the share of labour in NFCs fluctuates slightly while remaining stable overall. It then climbs by more than three percentage points before dropping one percentage point after 2013 to a level at the end of the period that remains higher than its pre-crisis level. These trends with regard to France illustrate the difficulties involved in developing an overall assessment of the sharing of value added since the 1980s.
An increase in services and a decline in industry since 2008
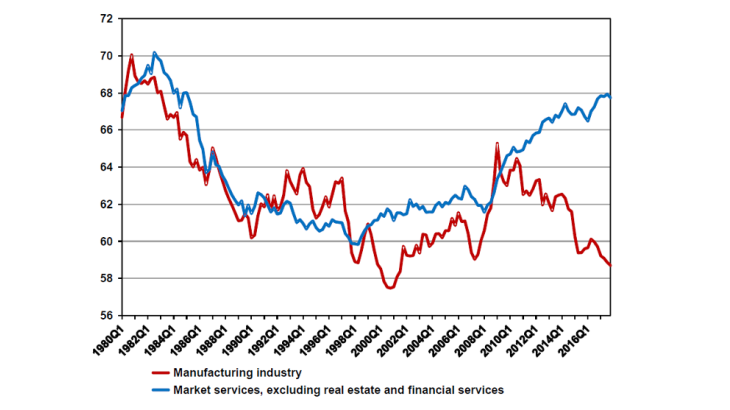
The above assessment can be developed further by examining the changes in the main sectors of the economy. In order to examine a scope that approximates that of NFCs-IEs, we focus on manufacturing industry on the one hand and market services, excluding real estate and financial services, on the other.
The trends appear to diverge significantly (see Chart 2). In both sectors, the share of labour compensation in 2008 was similar to its level in the 1990s, with cyclical fluctuations over the period. This share then surged in market services to a post-1985 high at the end of 2017. By contrast, after a cyclical peak in 2010, the share dropped sharply in manufacturing industry to reach a low that had only previously been observed at the beginning of the 2000s.
The methodology behind this finding is not exempt from criticism, as is noted, for instance, by Insee (2017). For example, the consequences of changing trends in self-employment and temporary work should also be examined. Furthermore, a recent blog post to the Eco Notepad discusses the growing weight of consumption of fixed capital in the gross value added of businesses. For the purpose of this blog, this component is implicitly attributed to "return on capital".

Source: Insee, authors’ calculations
It is useful to analyse the contributions of the various market services sub-sectors (at level 17) by distinguishing: (i) the structural effect related to the change in the relative weight of the sub-sectors and (ii) the intra-sector distortion effect on the sharing of value added.
The recent increase in the weight of labour compensation in the gross value added of market services has little to do with structural effects. It mainly derives from the extremely significant upsurge observed in three sectors: trade, business services and information-communication. We should repeat that the increase in the weight of labour compensation is not necessarily the result of an improvement in workers' bargaining power: it can be due to intensified competition in the sector driving down businesses' market power, as is the case in the telecommunications sector.
Updated on 25 July 2024