Post No. 397. After reaching an all-time high during the pandemic, the household saving rate has decreased but remains more than 3 percentage points above its pre-Covid level. We show that changes in the composition of household income, driven mainly by the increase in net financial income resulting from interest rate developments, largely explain why the saving rate remained high in 2023-24.
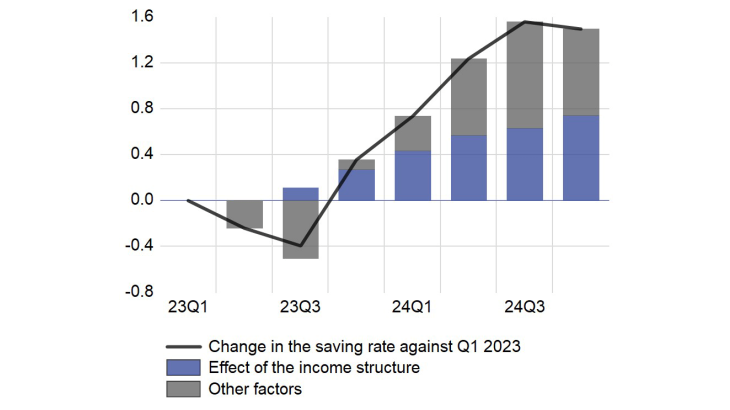
Chart 1: Changes in the saving rate since the first quarter of 2023 and contribution of the composition effect (percentage points)

Income from assets has grown faster than other income components in the recent period.
Based on national accounts, household gross disposable income (GDI) is the income available to households for consumption or investment, after taxes and social security contributions. Labour income, which includes wages and the gross operating surplus (GOS) of individual entrepreneurs, makes up the lion's share. Then, in order of contribution, there are cash social benefits, income from assets (including net financial income and income from real estate) and other transfers. Taxes and social security contributions are then deducted from these different sources of income to obtain the gross disposable income.
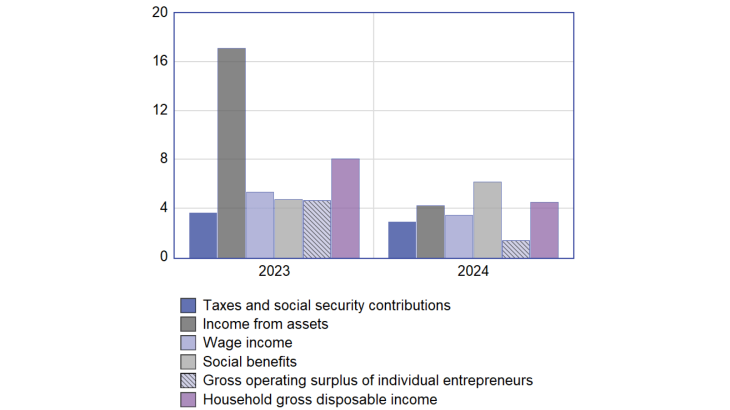
Over the 2023-24 period, income from assets contributed strongly to the growth in nominal household gross disposable income, particularly in 2023 (up 17.1% compared with 8.0% for nominal GDI), while the increase in labour income (wages and GOS of individual entrepreneurs) was lower than that of GDI (Chart 2). This growth in income from assets led to a rise in its share of household disposable income, which increased from 21% to 23%. The share of labour income fell from 71% to 68% of gross disposable income.
This sustained increase in income from assets was partly due to the monetary policy response to the sharp rise in inflation that occurred as of the beginning of 2022. This is because key interest rate hikes by the central bank were passed on to the rates of return on term deposits and euro-denominated life insurance policies, while the interest paid by households on their loans, most of which are at fixed rates, increased less. Furthermore, some household savings passbooks offer inflation-based rates of return (Livret A, popular savings passbooks (LEP) or sustainable development passbooks (LDDS)). Other financial income (including dividends) also increased over the period.
Chart 2: Annual growth rate of the components of household gross disposable income (%)

The income composition effect via the increase in financial income automatically results in a rise in the saving rate.
Within household disposable income, the different sources of income are not saved in the same proportions. In particular, financial income is saved more than labour income, for a number of reasons. Firstly, for a given household, its propensity to consume is lower for financial income than for other income, because the financial assets held are intended to finance exceptional (precautionary savings) or long-term (such as retirement) needs. Moreover, a large part of the financial income (particularly that from life insurance) is in practice immediately and automatically reinvested. Secondly, the different incomes are not held in the same proportions among the different categories of households. Financial income is generally held by households at the top of the income distribution, whose marginal propensity to save is generally higher. Lastly, and more specifically during this period, a large part of the increase in the face value of financial income reflected an offsetting of the devaluation of the corresponding financial assets through inflation, and was therefore not considered to be a gain that could be spent.
The mechanism behind the impact of financial income on the saving rate is therefore as follows: if the increase in disposable income came only from financial income (which is largely re-saved), then consumption would hardly increase and the saving rate would rise. The opposite phenomenon would occur if financial income were to fall.
To illustrate this point, we examine the change in the saving rate by looking at two contributions. The first contribution corresponds to the change that would have occurred if wages had remained constant as a proportion of disposable income. This is a sort of underlying saving rate whose change depends only on the ratio between consumption and wages, which is a stable component of income with a marginal propensity to consume close to total income's propensity. The second contribution concerns the change in the share of wages in gross disposable income, keeping the ratio between consumption and wages constant: an increase in this contribution would correspond to changes in the composition of household income in favour of income from assets, for example, with a constant ‘underlying’ saving rate. Given that the rise in interest rates began in 2022, and taking into account the time it takes for households to invest and borrow, we calculate the contributions starting from the first quarter of 2023.
Chart 3: Breakdown in the change in the saving rate since the beginning of 2023

Note: By construction, the change in the saving rate (black curve) is not strictly equal to the sum of the two contributions. In practice, the difference is very small (less than 0.1 of a percentage point).
Chart 3 shows that the increase in the saving rate between the beginning of 2023 and the end of 2024 (of 1.5 percentage points) is mainly due to the composition effect of income. The portion saved from wages even initially decreased before returning at the end of 2024 to its level of the first quarter of 2023. In other words, the increase in the saving rate observed since 2023 appears to stem mainly from the shift in the composition of income towards financial income, rather than from a change in the underlying ratio between consumption and labour income.
An econometric approach to quantify the composition effect
The impact of the income composition effect presented above is purely a matter of accounting, insofar as no assumptions are made about the economic behaviour of households vis-à-vis the shift in the income structure. Furthermore, the contribution of the component linked to the change in the share of the wages in income calculated using the accounting approach tends to overestimate the composition effect because it is based on the implicit assumption that all income excluding wages is fully saved. In order to quantify this effect more precisely in the current rise in the saving rate, we use an econometric consumption equation similar to that presented in Ouvrard and Thubin (2020). This model takes into account the share of a number of components of household income in order to capture structural effects. In particular, we look at the share of income from assets (income from property and financial assets), taxes and social security contributions; and the gross operating surplus of individual entrepreneurs in household income. According to this equation, a shift in the structure of income from income from assets (1 percentage point increase in the GDI of income from assets, with total income remaining unchanged) would lead to a rise in the saving rate of around 0.4 of a percentage point.
We then carry out a simulation exercise for the 2023-24 period, in which we compare two scenarios. In the first scenario, the shares of the different components of income change in line with the data published by INSEE. In the second scenario, these shares remain at their levels of the first quarter of 2023, with an identical change in total income. We then interpret the difference in saving rates between these two scenarios as the contribution of the income composition effect to the change in the saving rate over this period.
The results of these simulations show that the income composition effect appear to have contributed 0.7 percentage point to the 1.5-percentage point increase in the saving rate in 2023-24. This effect appears to stem entirely from the increase in income from assets (Chart 1).
In 2025, we expect the saving rate to start falling, with a change in the composition of household income that would be more favourable to consumption than to savings. Indeed, the share of financial income in household gross disposable income is expected to fall in line with the decline in interest rates. At the same time, the delayed adjustment of nominal wages to the past rise in inflation should support the purchasing power of labour income, and therefore also consumption.
Download the full publication
Updated on the 21st of March 2025