- Home
- Publications et statistiques
- Publications
- What economic sectors contribute to land...
What economic sectors contribute to land take in France?
Post No.362. A new study has identified the economic sectors - such as Wholesale & retail trade and Manufacturing - that are the biggest users of built-up land (stock), and those - such as wholesale and retail trade - that contribute most to land take (flow), even though this flow has decreased since the end of the 2000s. Nevertheless, the sectors that contribute the most to land take are not necessarily the most vulnerable to the “no net land take” policy.
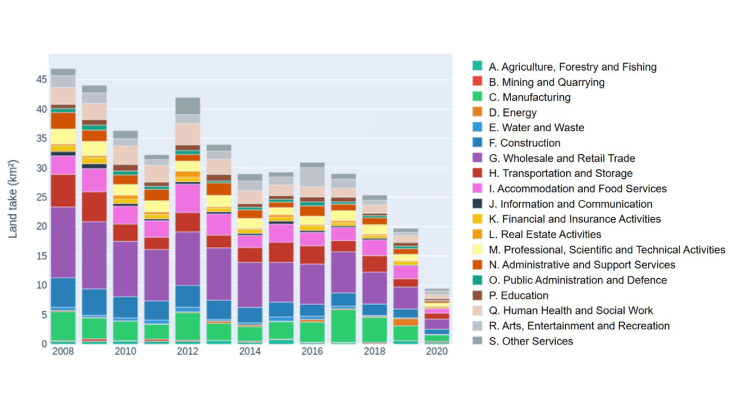
Chart 1: Contribution to land take by economic sector in France

Note: In 2018, the economic sector that contributed most to land take was Wholesale & retail trade. This Chart represents land take due to the construction of buildings dedicated to economic activity and therefore does not include that due to the construction of housing or infrastructure. Since our methodology underestimates the amount of land take linked to economic activity, these figures should be read in relative terms - to compare one sector with another - rather than in absolute terms.
Calculations: Authors.
According to Cerema, between 2009 and 2022, 25,000 hectares per year – i.e. the equivalent of the area of Val-de-Marne – of natural or agricultural land in France were converted into built-up areas, a process that is called “land take”. Land use change, which includes land take, is the main cause of the alarming loss of terrestrial biodiversity around the world and the alteration of the biosphere on which humanity depends. Living soils provide essential services to humans, such as carbon storage and flood prevention. Thus, protecting soils against land take is a crucial aspect of the green transition. While land take linked to the construction of housing is well documented, much less is known about that caused by buildings used for economic activity, even though it accounted for around a quarter of land take (just under 5,000 hectares per year) over the last decade. We analyse this phenomenon in the study presented here.
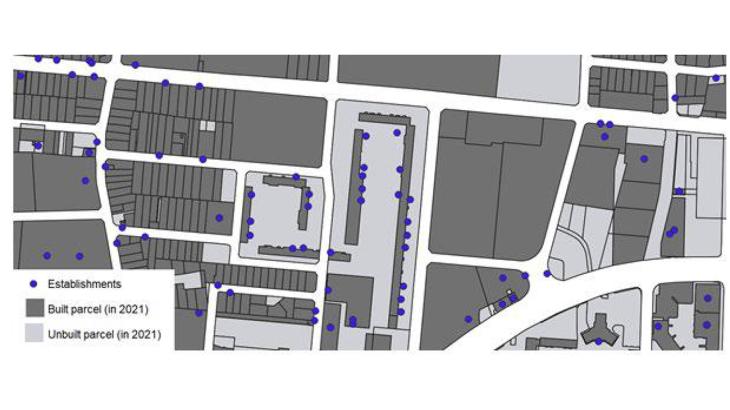
What economic sectors have contributed most to land take? How do they use built-up land in their production process? In order to answer these questions, the study is based on an original methodology: for each built-up plot, we identify the business establishments that occupy it, thanks to a spatial matching procedure based on their geolocation (Chart 2). This enables us to calculate the built-up area occupied by each establishment, which is then aggregated at the level of the sector of activity; we thus obtain annual accounts detailing for each sector (i) its contribution to land take (the flow of new built-up land) and (ii) its use of built-up land (stock) between 2008 and 2021.
Chart 2: Spatial matching of plots and business establishments

Note: Only the part of the parcel dedicated to economic activity is considered.
Wholesale & retail trade is the biggest contributor to land take, in a general context of reduction in the use of land.
This database shows very different contributions to land take across sectors. Wholesale & retail trade (sector G) is the biggest contributor, although its relative share has decreased over the years (from 30% at the end of the 2000s to less than 20% at the end of the 2010s). Conversely, Manufacturing (sector C) has seen its contribution to land take increase over the same period, reaching 20% in 2018. It should be noted, however, that in this paper we define “contributors to land take” as the users of the newly built-up land, without taking account of the role of other players, such as the local authorities that grant planning permissions, the construction sector or even the owners of buildings.
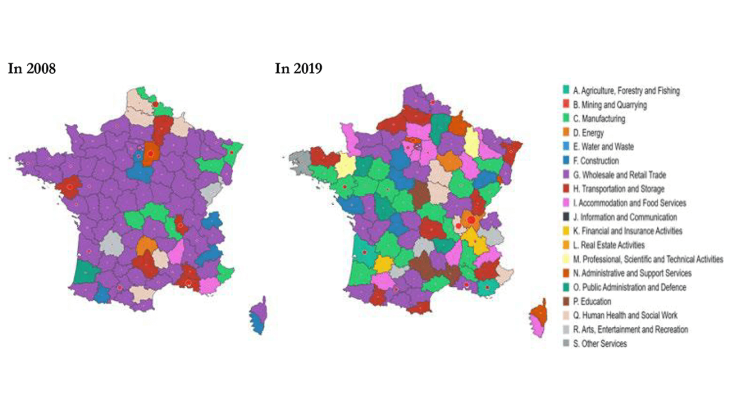
Finally, a geographical differentiation of the results shows that these dynamics can vary according to the local context (Chart 3). While Wholesale & retail trade was the main contributor to land take in most départements in 2008 (left-hand map), the picture was much more mixed in 2019, with Manufacturing, Accommodation & food services, and Transportation & storage accounting for a significant share of land take (right-hand map). This sectoral diversification is also spatial: the volume of land take for economic activity (red circles) is less concentrated around the Île-de-France region than it used to be.
Chart 3: Main sector taking land by département

Note: In 2008, the economic sector that took the most land in the Val d'Oise was Wholesale & retail trade. The size of the red circle increases with the amount of built-up land used by economic activity in the département.
Calculations: Authors.
Wholesale and Retail Trade and Manufacturing are the main users of built-up land
The use of built-up land (which represents around 8% of the national territory, including all uses - housing and economic activity) also varies across sectors. Once again, Wholesale & retail trade and Manufacturing stand out in terms of total built-up land use, but the ranking changes when we calculate the average area per establishment by dividing the sectoral built-up land use by the number of establishments in the sector: the Mining & quarrying sector makes the most extensive use of built-up land per establishment (14,000 m2 on average), followed by Energy and Water & waste (around 4,500 m2 on average). There are also significant differences within the sectors themselves, particularly in Manufacturing, where built-up land use per establishment is very heterogeneous, reaching, for example, an average of 70,000m2 for a steel production.
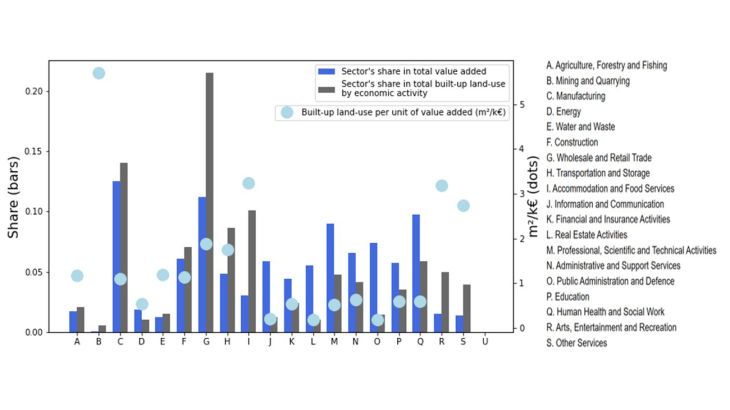
Finally, we put forward a measure of land use efficiency (or intensity), which represents the average area of land in m² required to produce one euro of value added in each sector. Once again, the results show considerable sectoral heterogeneity: to produce EUR 1,000 of value added, companies in the Information & communication sector (sector J) require just 0.1m², while those in the Accommodation & food services sector (sector I) require more than 3m² on average.
Chart 4: Land use intensity of production by sector in 2018

Note: As sectors’ built-up land use is underestimated with our methodology, these figures should be read in relative terms - to compare one sector with another - rather than in absolute terms.
Given their use of built-up land, how vulnerable are these sectors to a possible shortage of land?
These new data correspond to an environmental extension of the financial accounts of economic sectors. They therefore represent a first step towards understanding the complex links between economic activities and land availability: if companies use space to produce, a decrease in the availability of land could in turn affect their development. The “no net land take” (NNLT) objective, which was inscribed in the French law in 2021, aims to reduce the rate of land take and imposes that this rate be halved by 2031 compared with the decade 2011-2021. In order to assess sectoral vulnerabilities in a scenario where the NNLT policy would increase the price of built-up land (although this is not a necessary consequence of the law), we combine these built-up land use and land take accounts with additional data, such as company balance sheets. Our analysis is based on various criteria that disentangle the different components of vulnerability: while some sectors seem more likely to be exposed to higher land prices because of their significant use of built-up land, they would not necessarily be losing from this transition policy. For example, most companies in manufacturing own the land they use (source: Fiben) and should therefore benefit from a rise in real estate prices. Furthermore, some sectors could adapt more easily to a new context of land sobriety, for example by increasing their land efficiency.
By exploring the type and area of built-up land used by different sectors, our work is in line with the literature that aims at (re)integrating land as a factor of production. We are also contributing to the still relatively unexplored field of study on the economic consequences of protecting biodiversity. Finally, we are contributing to a better understanding of the risks associated with a sustainable transition, beyond those brought about by the low-carbon transition. In particular, analyzing the possible economic vulnerabilities in the face of a transition policy such as NNLT makes it possible to identify the potential winners and losers of this policy. It also raises the question of the tools that are likely to promote a reduction in the demand for built-up land - for example, by encouraging economic sectors to alter the way they use land through technical or organisational changes. As already pointed out by classical economists, land is a finite resource and managing its scarcity should reemerge as a matter of concern in economics.
Download the full publication
Updated on the 1st of August 2024