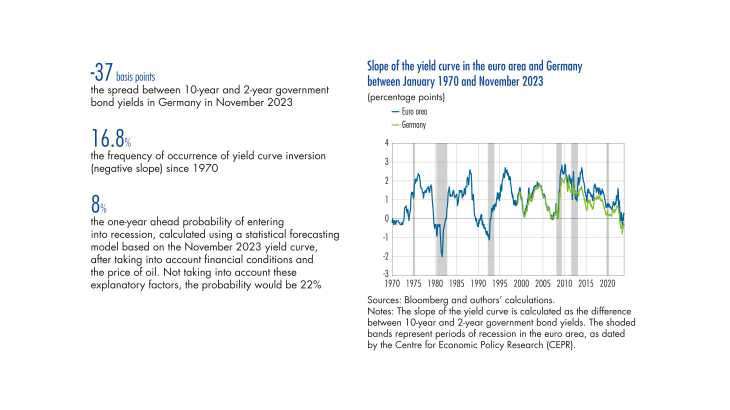
In June 2023, the inversion of the yield curve (when 2 year government bond yields rise above the 10 year yields) stoked fears of a recession in the euro area. Despite a slight upturn in 2021 and 2022, the spread between long term and short term euro area bond yields, known as the “slope of the yield curve”, has fallen into negative territory, and to its lowest level since the recession of 1992 (see Chart 1). This observation is particularly striking in the case of German bonds, which are more sensitive to key interest rate expectations and less susceptible to default risk. Indeed, the slope reached -37 basis points in November 2023.
The slope of the yield curve is highly volatile over time, but typically stays in positive territory because investors demand additional compensation for making long term investments (a “term premium”). Therefore, a negative slope is relatively rare, but not unprecedented. It is conventionally perceived as a signal of recession. However, there is no consensus among economists as to the mechanisms behind this correlation, and the correlation itself is undermined by major exceptions, such as the sovereign debt crisis that rocked the euro area between 2010 and 2012 and the public health crisis of 2020: neither were preceded by an inverted yield curve. Furthermore, as the indicator is extremely volatile, assessing the risk of a recession becomes highly dependent on the date taken into consideration.
For some time now, the academic literature has explored the link between the slope of the yield curve and the risk of recession using “probit” statistical models (Estrella and Hardouvelis, 1991, Estrella and Mishkin, 1998, Rudebusch and Williams, 2009, for the United States; Sabes and Sahuc, 2023, for the euro area). These studies show a high degree of statistical regularity between the yield curve and recession in the United States, but the link is not systematic for the euro area.
The yield curve inversions observed in the euro area since June 2023 also give us cause to re examine this link. This bulletin therefore aims to review and explain forecasts of recession in the euro area based on the yield curve.
[To read more, please download the article]
