Eco Notepad

Is there a bubble in “green” equities?

Published on 26 October 2021
Authors : Tristan Jourde, Arthur Stalla-Bourdillon

Post n°235. Given the recent outperformance of those sectors best-positioned to accompany the ecological transition, some commentators have voiced fears that a bubble might be emerging in “green” equities. A systematic analysis based on the environmental scores (the “E “in ESG) of over 2,500 stocks in the Datastream Global Equity Index suggests that these fears may be overdone.

Image Chart 1: Trajectory of prices for clean, neutral and polluting sectors Source: Datastream. Scope: World. BdF calculations.
Chart 1: Trajectory of prices for clean, neutral and polluting sectors Source: Datastream. Scope: World. BdF calculations.

The series show the prices of portfolios containing stocks in clean, neutral and polluting sectors respectively. Prices (equally weighted average for all firms in the portfolio) have been normalised to 100 in January 2018.

The “green bubble” narrative

Since the negative Covid-19 shock in March 2020, most equity indices have rebounded sharply, despite ongoing uncertainties over how the pandemic will evolve (gain of 28% in the S&P 500 between February 2020 and July 2021). A rise of this magnitude can be worrying if it signals that markets are disconnecting from their fundamentals, as this tends to increase the risk of a stock market correction (Chatelais and Stalla-Bourdillon, 2021). 

Against this backdrop, certain sectors have risen more than others. To illustrate, Chart 1 shows the price trajectories for more than 2,500 global stocks, grouped according to whether they belong to a sector that is “clean” (clean fuel, renewable energies, etc.),

“polluting” and hence adversely affected by the ecological transition (oil, road transport, etc.), or “neutral”. While all three portfolios were negatively affected by the March 2020 shock, clean sectors have considerably outperformed polluting sectors in recent years. This has prompted some commentators to warn that a bubble might be forming in green assets (Aramonte and Zabai, 2021)

However, the phenomenon described above does not necessarily equate to a speculative bubble. First, equity prices need to be viewed against company fundamentals (using valuation metrics such as the price-to-earnings ratio or PER) in order to determine whether they are overstretched. Second, the “clean” portfolio shown in Chart 1 contains a limited number of firms, concentrated in just a few sectors. Any overvaluation of these assets is likely to be a localised phenomenon, and will only partially affect investors, as their positions tend to be more diversified.

Instead of focusing on the potential overvaluation of a small number of sectors, we take a broader approach based on the environmental score of companies (the "E" in ESG). In other words, our analysis focuses on the following question: for the economy as a whole, are companies with a better environmental score systematically overvalued? To this end, we construct a “green” portfolio containing a large panel of firms, selected on the basis of their environmental scores (Chart 2). Firms’ environmental scores incorporate measures such as their CO2 emissions, their environmental performance and their strategy towards renewable energies. The scores are normalised within each sector, leading to a "best-in-class" selection, preferred by most shareholders (i.e. investing in firms with the highest scores in their particular field of activity, and without excluding any sectors). Thus, our framework makes it possible to test whether there is a broad-based green bubble, which would be more damaging for investors.

Valuations are more conservative than expected

In theory, complying with environmental standards can have both a positive and negative impact on a firm’s valuation. If investors expect environmental risk to rise, this can push up the valuation of green assets, as investors will use them as a risk-hedging tool or to increase their exposure to the ecological transition (Pástor et al., 2020, Bolton et al., 2020). Demand for green assets can also be boosted by non-financial considerations (Fama and French, 2007). Finally, their prices may rise following their inclusion in popular indices, such as the MSCI Global Environment Index.

Conversely, a high environmental score may mean lower future profitability, especially if the firm’s management prioritises other goals over the maximisation of returns (Gillan et al., 2021). In addition, difficulties in assessing firms’ environmental performances and the risk of “greenwashing” result in a high rate of disagreement between environmental scores, which can in turn dilute green investment flows (Billio et al., 2020, Afota et al. 2021).

Chart 2 shows the median PER (using earnings for the last 12 months) for portfolios classified as “green”, “brown” and “neutral” based on thresholds set at the 30th and 70th percentiles of the environmental scores of the stocks used in Chart 1. As there is rarely a consensus over ESG scores, we construct a composite score using four sources: Asset4, CDP, RobecoSAM and Sustainalytics. We exclude from the analysis all firms for which disagreement over the environmental score was too high. However, the results are robust to the inclusion of all firms, and to the creation of portfolios based on the scores given separately by each source.
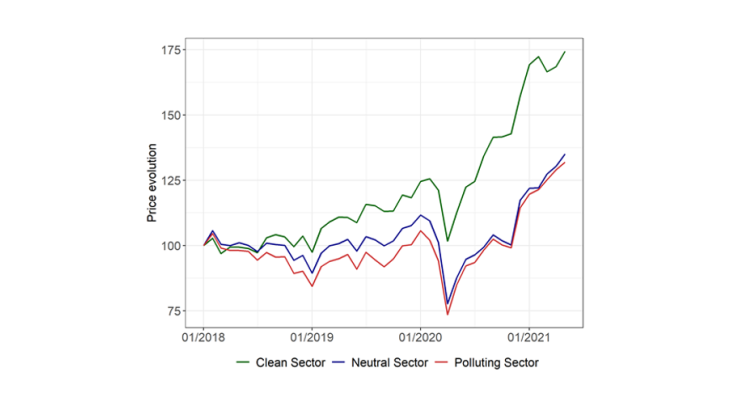
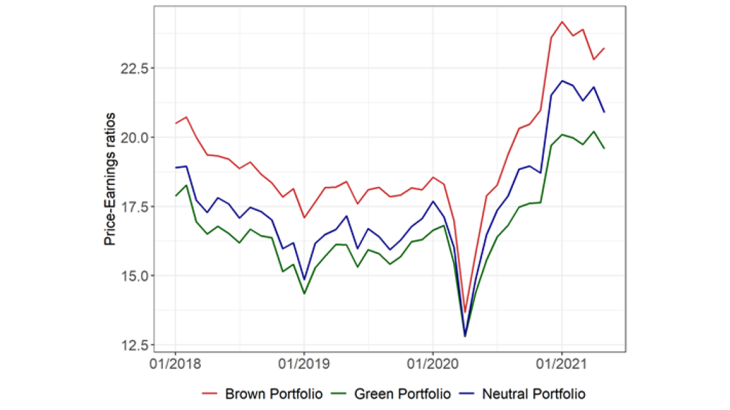
Image Chart 2: Price-to-earnings ratios of portfolios classified according to their environmental Sources: Datastream, Asset4, CDP, RobecoSAM, Sustainalytics. Scope: World. BdF calculations. The portfolios are classified as green/brown/neutral based on thresholds set at the 30th and 70th percentiles of the environmental scores.
Chart 2: Price-to-earnings ratios of portfolios classified according to their environmental Sources: Datastream, Asset4, CDP, RobecoSAM, Sustainalytics. Scope: World. BdF calculations. The portfolios are classified as green/brown/neutral based on thresholds set at the 30th and 70th percentiles of the environmental scores.

Chart 2 shows that, contrary to the “green bubble” narrative, firms with a high environmental score (in green) have lower valuations than firms with a lower environmental score (in red). This result holds true regardless of the valuation metric used – for example forward-PERs or risk premiums.

Admittedly, a sectoral approach (similar to that used in Chart 1) finds that clean sectors have higher valuation ratios than the rest of the market (PERs of 23.2, 21.0 and 20.1 respectively for clean, neutral and polluting sectors), but this remains a localised phenomenon that only affects a limited number of firms.           

Firm-level characteristics cannot explain the difference in valuations 

Aside from environmental considerations, several attributes can affect a firm’s valuation – for example its size (Large/Small), its book-to-market ratio (firms with high ratios are classified as Value stocks, those with low ratios as Growth stocks), its operating profitability, its level of debt, its investment policy (Dynamic/Conservative), and whether or not it operates in a sector or country that has a structurally higher valuation. 

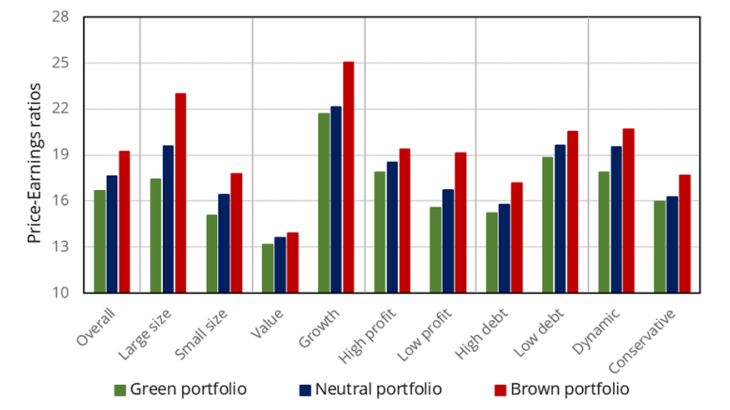
To take account of these effects, Chart 3 shows the average PER over the period 2018-21 for portfolios obtained by combining environmental attributes (green/brown/neutral) with the above-listed variables. The “Green – Large size” portfolio, for example, contains firms with a high stock market capitalisation and a high environmental score.

Image Chart 3: Price-to-earnings ratios of multi-factor portfolios Sources: Datastream, Asset4, CDP, RobecoSAM, Sustainalytics. Scope: World. BdF calculations. The chart shows average PERs for portfolios constructed by combining firms’ environmental scores with other attributes.
Chart 3: Price-to-earnings ratios of multi-factor portfolios Sources: Datastream, Asset4, CDP, RobecoSAM, Sustainalytics. Scope: World. BdF calculations. The chart shows average PERs for portfolios constructed by combining firms’ environmental scores with other attributes.

Even taking into account these other characteristics, the message remains the same:

regardless of portfolio type, green firms have lower valuations than brown firms. This result is robust in panel regressions, where we assess the impact of environmental scores on PERs after controlling for the same variables (size, debt level, etc.), and for the sector and country of the firms under consideration. All other things being equal, going from a low environmental score (average score for the brown portfolio) to a high environmental score (average score for the green portfolio) equates to a loss of 2.6 points in PER.

Therefore, despite recent warnings about the emergence of a speculative bubble in green equities, a systematic analysis based on firms’ environmental scores suggests this assessment is overdone: stocks with a high environmental score appear to have lower valuations. The discount found here can be explained by the negative theoretical channels described above (disparities between environmental scores, pursuit of other goals by the management), or by the fact that investors believe environmental risks remain contained and are not prepared to pay a premium for firms that are less exposed.

According to a recent review of the literature by Gillan et al. (2021), this result contradicts most (but not all) previous studies on the impact of firms’ corporate social responsibility on their stock market valuations. Several factors may justify this divergence, notably the fact that we focus specifically on firms’ environmental performance rather than on the broader notion of corporate social responsibility. In addition, our study, which looks at a large number of listed stocks over the recent period, does not rule out the possibility that certain more restricted segments of the market or other asset classes may be overvalued.

Updated on 25 July 2024