- Home
- Publications et statistiques
- Publications
- The technology balance of payments of Fr...
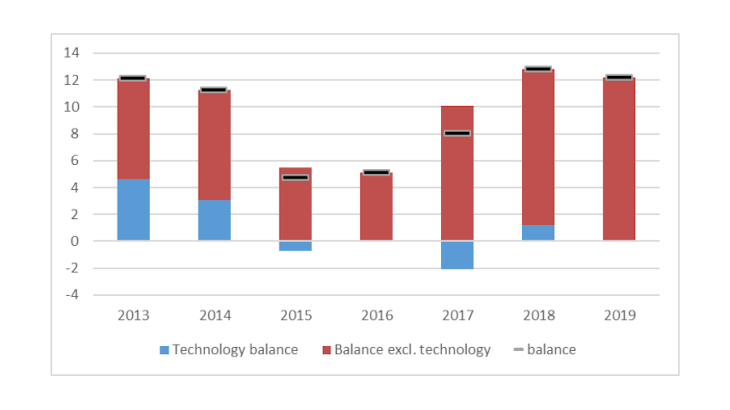
Post n°187. The technology balance of payments (TBP) provides a framework for analysing international technology transfers. After displaying a surplus in 2018, France's TBP stood at equilibrium at the end of 2019. The European Union's TBP shows a surplus comparable to that of the United States.

Source: Banque de France
The technology Balance of Payments: an indicator of globalisation
The technology balance of payments is an indicator developed by the OECD to better understand the globalisation process by measuring the international technology transfers between countries. It measures imports and exports of services with a strong technology component (Research & Development (R&D), rights to use intellectual property - patents, licences and trademarks -, scientific and computer services).
It makes it possible to establish a link for a given country between its economic performance and the international exchange of services related to its technological activities. Lastly, it provides information on the interdependence between a country and its technology partners (see, for example, Italy's TBP, published by the Banca d'Italia).
Over the past two years, the TBP has contributed to the improvement in the overall services balance (excluding insurance and tourism) within the balance of payments (see Chart 1). After registering a deficit between 2015 and 2017, trade in technological services recovered to become slightly positive as of 2018 and at equilibrium in 2019.
Imports of R&D and exports of services related to intellectual property almost offset each other
Transfers of technology services with non-residents can be broken down between R&D, scientific and computer services and those related to the use of intellectual property. They correspond to specific balance of payments classifications and thus allow for international comparisons.

Source: Banque de France.
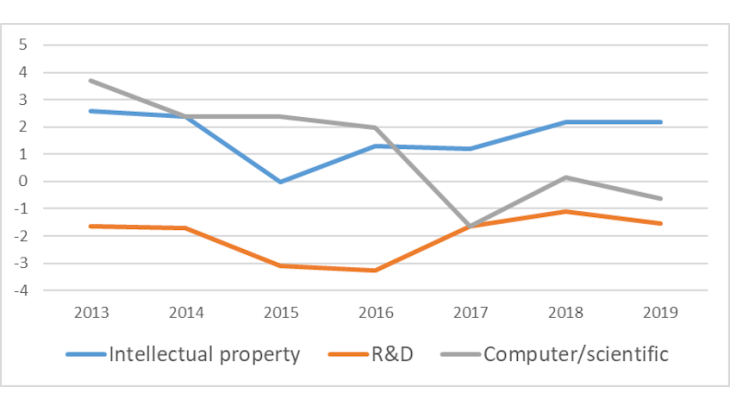
Between 2013 and 2019, trade in intellectual property-related services recorded an average annual surplus of EUR 1.7 billion (see Chart 2), while trade in R&D-related services registered an average deficit of around EUR 2 billion. The balances for these two types of service worsened in 2015-2016 but have since improved slightly.
Conversely, the balance of scientific and computer services has declined significantly, moving from a surplus of nearly EUR 4 billion in 2013 to a deficit at the end of 2019 (EUR -0.6 billion), probably due to the trend of French companies relocating their computer support services abroad (back-office, etc.).
Significant sectoral and geographical differences
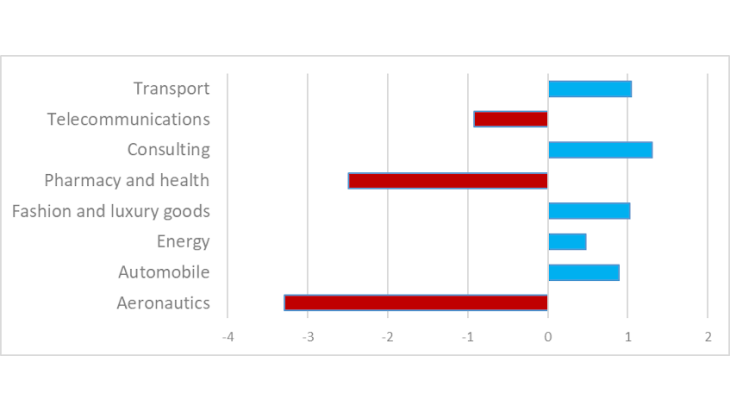
The areas of activity generating these flows can be identified by analysing the reports submitted by large companies to the Banque de France. The fashion and luxury goods, automobile, consultancy and transport sectors made a positive contribution to the TBP balance (see Chart 3): each of these sectors has had a relatively stable surplus, with an average of around EUR 1 billion, depending on the year. The automobile sector is a net exporter of R&D services.
Conversely, the pharmaceutical, aeronautics and, to a lesser extent, telecommunications sectors have displayed a significant deficit. The net imports of the aeronautics sector amounted to approximately EUR 3 billion per year over the period under review. The aeronautics industry, which is also a net exporter of goods and which has maintained production centres in France, therefore includes in its exports of goods the technology services it purchases abroad. This is also the case for the pharmaceutical industry which, despite being a net importer of these services, is a net exporter of goods.
Lastly, telecommunications, which has been severely impacted by restructuring in recent years, has at last seen its deficit of slightly less than EUR 1 billion stabilise over the period under review.

Source: Banque de France.
Note: Collection of direct reports by the Balance of Payments Directorate
The United States, Germany, the United Kingdom and, to a lesser extent, Spain account for more than half of France's foreign trade in technology services.
France recorded a deficit of EUR 4.5 billion in its trade in technology services with Germany at the end of 2019, which has increased significantly in recent years, due to a rise in its spending on services related to intellectual property. It is also increasingly a net importer vis-à-vis the United Kingdom, but to a lesser extent (EUR -1.6 billion). Lastly, trade, particularly in the use of intellectual property, is substantial but at equilibrium with the United States and shows a slight surplus with Spain, thanks to income from computer services.
Significant European Union TBP surplus and national differences in Europe in 2019
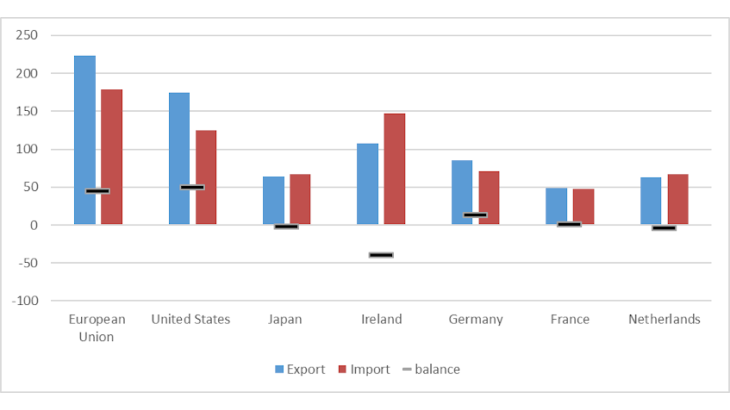
EU exports and imports are significantly higher than those of the United States and Japan (see Chart 4). The EU had a surplus of nearly EUR 45 billion at the end of 2019, a level equivalent to that of the United States and well above that of Japan.

Source: OECD
Germany, France, Sweden and Finland are the main contributors to the EU's surplus. Thanks to the establishment of international groups in Ireland, this country enjoys a very high volume of exports of computer services. However, this is more than offset by strong imports of R&D services and intellectual property. Overall, Ireland makes a negative contribution to the EU's TBP. The Netherlands, with its high volumes of exports and imports of technology services, also contributes negatively to EU’s TBP.
As regards the geographical breakdown, the EU has a surplus, particularly vis-à-vis China (EUR 12.7 billion), Singapore (8.3), Japan (4.2), Australia (4.4) and Russia (4.3). By contrast, it shows a deficit vis-à-vis the United States (EUR -11.6 billion due to a significant deficit in remuneration for the use of intellectual property.
Updated on the 25th of July 2024