Eco Notepad

The stages in France’s European financial integration

Published on 12 January 2023
Authors : Iris Chagnaud, Jean-Baptiste Gossé, Florian Le Gallo, Rémy Lecat

Post n°300. France’s European financial integration, measured by its capital flows to its main partners, accelerated strongly with the introduction of the euro and European measures designed to unify financial services. It fell back significantly with the global financial crisis and then the euro area debt crisis. Its recovery in 2018-19 has since been tested by the Covid-19 and energy crises.

Image Chart 1. France’s net capital flows abroad (1980-2021, % of GDP) Source: BDF and BIS, authors’ calculations.
Chart 1. France’s net capital flows abroad (1980-2021, % of GDP)
Source: BDF and BIS, authors’ calculations.
Note: Total flows of direct investment, portfolio investment and other investment. EU-10: Benelux, Denmark, Germany, Greece, Ireland, Italy, Portugal and Spain. Breakdown by country missing for 1994, 1995 and 1999.

This post analyses France’s European integration using international capital flows. Drawing on archive of publications and data from the Banque de France and the Bank for International Settlements (BIS), we construct a database of France’s annual financial flows to and from its main partners since 1980. Some series contain methodological breaks due to changes to the statistical framework over the period. The developments they show from 1980 attest to the transition from a compartmentalised national market to the “great European market”, in the context of Member States’ growing financial openness.

An initial development during the 1980s                       

The project of European construction included a financial dimension from its inception. The first wave of liberalisation was focused on setting up the common market, which removed restrictions on some movements of commercial and private capital (directives of 1960 and 1962). In 1980, total financial flows to and from France remained pretty small, i.e. 2% and 1% of GDP respectively. They then grew steadily to reach around 7% of GDP on the eve of the introduction of the euro (Chart 2).

Image Chart 2. Net capital flows from and to France (% of GDP) Source: BDF and BIS, authors’ calculations. Note: Net inflows and outflows, broken down by country of residence of first counterparty (divestment where sign negative).
Chart 2. Net capital flows from and to France (% of GDP) Source: BDF and BIS, authors’ calculations. Note: Net inflows and outflows, broken down by country of residence of first counterparty (divestment where sign negative).

The growth in financial flows over the period resulted particularly from the reorientation of government economic policy, which helped to strengthen its credibility (Drumetz, 2003), and the different financial liberalisation measures implemented during the 1980s against the backdrop of large current account deficits (need for foreign currency). Thus, the gradual opening-up of the possibilities for financial transactions abroad, the creation of a futures market and the launch of fungible Treasury bonds open to foreign investors helped to attract foreign capital (Quennouëlle-Corre, 2018). This first wave of liberalisation concluded with France’s early implementation in 1990 of the Community directive on the complete opening of the capital account.

Through these measures, France succeeded in attracting more capital and supporting substantial foreign direct investment (FDI) by French firms in the 1990s, against a backdrop of financial liberalisation within the EEC.

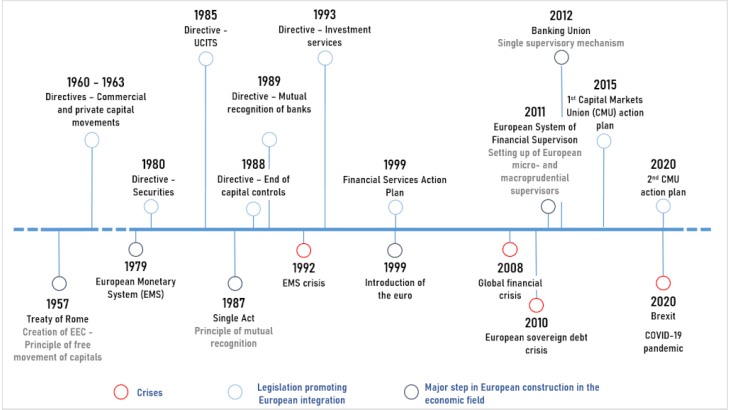
Image Diagram. Stages in European financial integration Source: Authors.
Diagram. Stages in European financial integration Source: Authors.

Growth in European financial integration after the introduction of the euro

The changeover to the single currency altered the scale of financial flows, particularly as a result of the removal of exchange rate risk. Following isolated sectoral directives in the 1980s and 1990s, the euro’s introduction was accompanied by the Financial Services Action Plan, an overall plan designed to promote intra-EU financial flows (see diagram). Comprising 27 directives implemented between 1999 and 2007, it contributed directly to the acceleration of intra-euro area flows by harmonising the regulatory framework (Kalemli-Ozcan et al., 2010).

Financial integration in the 2000s was then mainly driven by outward direct and portfolio investment. France’s financial flows to the EU thus reached 18% of GDP in 2007, and were directed particularly at Germany, the Netherlands and the United Kingdom (mainly in the form of direct investment), whereas its integration with the rest of the world outside the EU stagnated at around 9% (Chart 1). France’s portfolio flows to Southern European countries (Spain, Italy, Greece and Portugal) and Ireland also increased, in the context of growing domestic imbalances in these countries. The composition of France’s financial flows to the EU changed substantially, with a sharp increase in debt purchases (portfolio investment in debt securities and other investment – Chart 3). These outflows were financed, in turn, by inflows of portfolio investment and other investment (mainly interbank loans) from countries outside the euro area, which reached 18% of GDP in 2004. France thus played the role of intermediary of financing flows between the rest of the world and the euro area.

The decade of crises: the global financial crisis and euro area debt crisis

As a result of the financial crisis in 2008 and the European debt crisis in 2010-12, French financial outflows shrank temporarily, with divestment in 2008 regarding other investment, and in 2011 for portfolio investment. The fall in intra-European flows was mainly due to the reduction in the size of banks’ balance sheets and the contraction in interbank lending (Emter et al., 2018), which was replaced by direct loans from the Eurosystem to banks (through the policy of tenders with full allotment).

Following the euro area debt crisis, there was also a sharp reduction in exposures to debt securities issued by the rest of the EU. With a vicious circle triggered, wariness of sovereign debt spread to banks that held a large share of government securities. Cross-border holdings of debt securities, especially government ones, in the euro area were thus reduced after the onset of the Greek debt crisis (by Haan and Vermeulen, 2018).

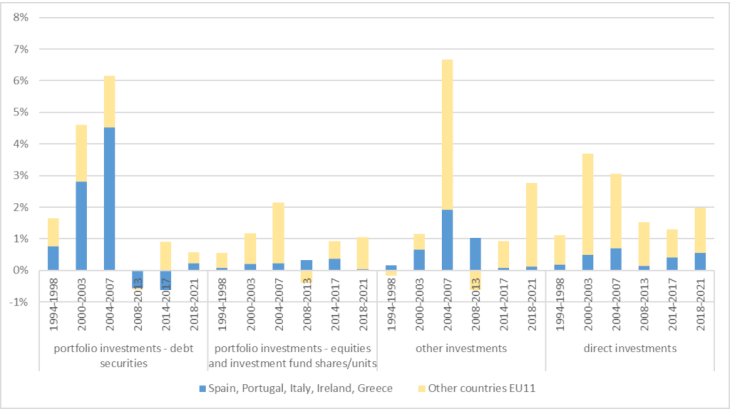
Since 2000, debt purchases have fluctuated more than purchases of capital (FDI and equities) in the rest of the EU. As in the rest of the world, FDI flows have been more resilient, particularly during the crisis periods.
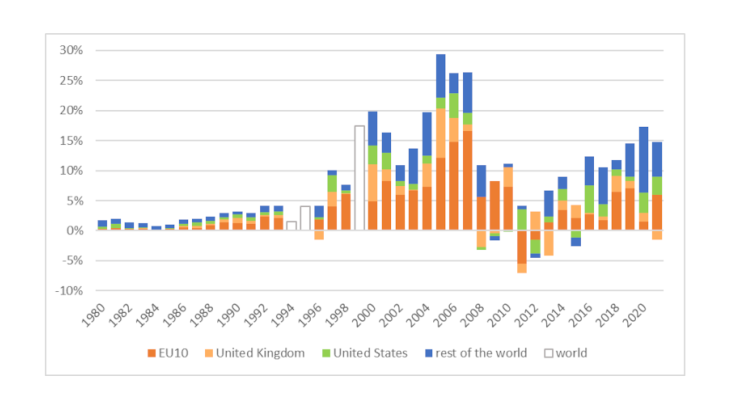
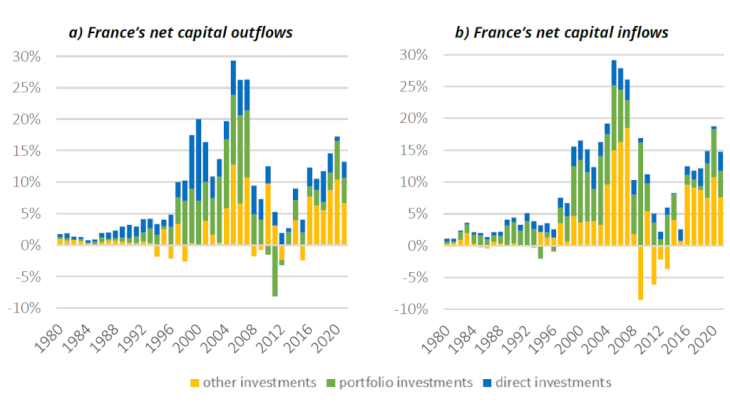
Image Chart 3. Detail of France’s capital flows to the EU-11 as a share of GDP (%) Source: Banque de France and BIS, authors’ calculations. Note: Data missing for 1999. France’s net investment outflows (investment - divestment)
Chart 3. Detail of France’s capital flows to the EU-11 as a share of GDP (%) Source: Banque de France and BIS, authors’ calculations. Note: Data missing for 1999. France’s net investment outflows (investment - divestment)

By reducing the risks associated with cross-border investment, growing integration through the Banking Union in place from 2014 (Bottineau et al., 2022) may help to explain the growth in other investment, with an increase in major French banking groups’ exposures centred on the euro area (excluding Southern European countries and Ireland). While their implementation remains incomplete, the European action plans on the Capital Markets Union (CMU) aimed at increasing the movement of capital within the EU, may have contributed to the recent upturn in integration. From the mid-2010s net purchases of equities and investment fund shares/units returned to levels only comparable with the early 2000s. After negative flows for Southern European countries and Ireland over the 2008-14 period (see Chart 3), intra-EU purchases of debt securities have remained low since 2014 and still very far from pre-crisis levels: this can in large part be explained by the Eurosystem’s non-standard monetary policy measures, leading to a withdrawal of non-residents from the euro area securities market (see Fact Sheet No. 1 of the French balance of payments annual report 2019).

The recovery of France’s capital flows to the European Union tested by fresh shocks

Net financial outflows resumed in 2016 with respect to total flows, and in 2018 for flows to the EU. The latter then regained their levels of the early 2000s, but remained below the – very high – levels of the middle of the decade. This recovery vis-à-vis the EU was mainly driven by other investment and, to a lesser extent, FDI.

Following Brexit, British financial entities have no longer been able to directly provide their services in the EU, and some activities have been relocated to the continent (e.g. equity trading in Amsterdam). This is reflected, on the one hand, in a fall in French investment flows to the United Kingdom (Chart 1) and on the other, as a corollary of the relocations, in an increase in exports of French financial services to that country (see the French balance of payments annual report 2021).

The Covid-19 crisis led to a temporary drop in financial flows, particularly in terms of FDI. The effects of the war in Ukraine have yet to be ascertained: the financial sanctions in particular could over the long term lead to significant changes in the configuration of capital flows, making it even more important to strengthen the EU’s economic resilience by deepening its financial integration (see, for example, the second CMU action plan in 2020).