Post No. 391. Since 2000, the EU-US gap has narrowed in terms of hours worked per capita but has widened in terms of GDP per hours worked. In France, this hourly productivity growth gap can be fully attributed to the most digitally intensive sectors — namely, producers and heavy users of IT technologies.
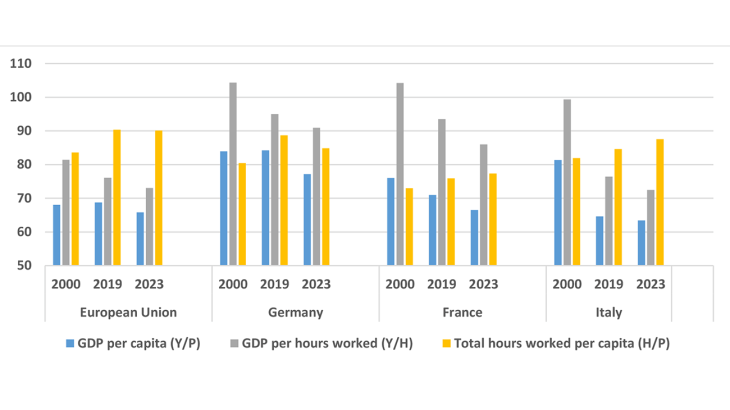
Figure 1: GDP per capita and GDP per hours worked as a % of US levels (US=100)

Note: Y/P, Y/H and H/P are expressed as a percentage of US levels for the EU, Germany, France and Italy. GDP is at constant PPP Prices (2015 = 100). H is total hours worked by employed population. P is total population.
Since the early 2000s, the gap in economic performances between the European Union and the United States has been widening. As pointed out in Bergeaud 2024, this gap reflects increasing differences in economic dynamism, productivity, labour market structure, entrepreneurship, innovation and investment in disruptive technologies. These issues are becoming of major concern for governments and policy makers due to their long-term consequences for welfare, living standards, fiscal sustainability, economic independence and sovereignty in key sectors of the economy. The Draghi report (Draghi 2024) stresses these points and calls for urgent and bold action to correct the trend.
Yet, the gap with the United States is heterogeneous across EU economies and – depending on how we measure it– it might appear more or less severe. This blog post provides evidence on the evolution of the gap with the US in terms of GDP per capita and GDP per hours worked. More specifically, it studies the extent to which differences in total hours worked and hourly productivity can account for this gap. Finally, it investigates the role of the production and adoption of digital technologies to explain the productivity growth gap.
Measuring the performance gap with the US and its evolution
We begin by examining GDP per capita (Y/P) for the EU, Germany, France, and Italy, expressed as a percentage of the US level (at constant PPP prices). As illustrated in Figure 1, in 2000, the EU's Y/P level stood at 68% of that in the US, indicating a gap of 32%. This gap remained relatively stable until the Covid-19 pandemic but slightly expanded to 35% by 2023. When focusing on the three largest EU economies, the initial gaps in 2000 were much smaller, as these countries were more advanced than the rest of Europe. However, their trajectories over time reveal a sharper relative deterioration. Germany's Y/P gap relative to the US increased from 16% in 2000 to 23% in 2023. France saw its gap widening from 24% to 33%, while Italy experienced the most dramatic shift, with its gap doubling from 18% to 36%.
The disparity with the US is much less pronounced when examining hourly labour productivity (Y/H), especially in the three largest EU economies. Yet the trend is more concerning. Indeed, in 2000, all three countries were at least as productive as the US on an hourly basis. Over time, however, hourly productivity deteriorated much more significantly relative to the US. By 2023, the Y/H gap had grown to 10% for Germany, 14% for France, and 28% for Italy.
Conversely, the gap in terms of total hours worked per capita (H/P) has significantly narrowed. For the EU, it has declined from around 20% below the US level in 2000 to 10% in 2023, broadly offsetting the effect on the GDP per capita gap of the deteriorating productivity relative performance. However, this has not been the case for the three largest EU economies, where the rise in relative hours worked has been insufficient to compensate the worsening of the productivity gap, translating into a relative fall in the GDP per capita gap for these countries.
Decomposing the GDP per capita gap
Differences in GDP per capita (Y/P) between countries can be further decomposed between hourly labour productivity (Y/H), hours worked per worker (H/L), employment as a share of the working age (15-64) population (L/A), or employment ratio, and the working age population as a share of total population (A/P). To better understand the factors driving gap with the US, Figure 2 decomposes it into these components. The relative share of the working age population has moved little since 2000. A marked change both at the EU level and in the three largest economies has been the narrowing of the gap with the US in terms of employment ratio. But this trend has been more than offset by the widening gaps in hourly productivity and in the number of hours worked per worker.
As a result, the hourly productivity gap (red bars) now accounts for the bulk of the GDP per capita gap in the EU and in Italy in particular. In Germany and France, the contribution of the hourly productivity gap has now become significant (more than one third of the GDP per capita gap in 2023, while its contribution was slightly negative in 2000); but the largest part of this gap remains due to the fewer number of hours worked (blue bars).
These results also highlight the fact that Europe has reduced its employment ratio gap. As argued by Garnier-Zuber (2023), this may have mechanically slowed labour productivity growth as the additional employed workers were less productive than average. However, the widening gap recorded in the largest EU countries in terms of GDP/working age population shows that this is only part of the story: overall efficiency in the use of labour resources has been increasing relatively less than in the US.
Figure 2: Decomposition of the GDP per capita gap vis-à-vis the US (%)

Note: Decomposition of the gap of GDP-per-capita at constant PPP Prices (2015 = 100) between the US and the EU, Germany, France and Italy.
The Key Role of the Tech sector
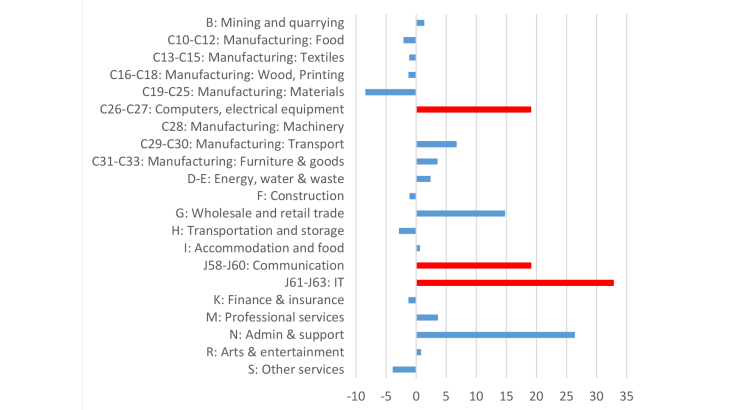
A key claim of the Draghi report is that “if we exclude the tech sector, EU productivity growth over the past twenty years would be broadly at par with the US”. Figure 3 applies US sectoral productivity growth rates to French sectors and shows the contribution of each sector as a percentage of the total difference between the counterfactual and actual French growth (the bars sum to 100%). The results are consistent with the Draghi report. Three sectors (red bars) explain more than two thirds (68%) of the difference: computing and electrical equipment, communications, and IT, which are obviously heavily tech-intensive. In addition, the two other major contributors, wholesale and retail trade and administrative support, have also become more productive in the US due to greater reliance on IT.
Figure 3: Decomposition of the France-US hourly productivity growth gap by sector, 2000-2019 (percentage points)

Note: Sectoral contributions to the aggregate France-US productivity growth gap over the 2000-2019 period. Red bars represent the three most tech-producing industries.
These results confirm that the Draghi report’s conclusions are relevant not only for the EU as a whole but also for France. In particular, they suggest that French policies should promote productivity-enhancing strategies in digitally intensive industries. It is now essential that the necessary further increase in the French employment ratio—which still has room for growth compared not only to the US but also to Germany—goes hand in hand with enhanced labour productivity, unlike the past trend.
Download the full publication
Updated on the 28th of February 2025