- Home
- Publications et statistiques
- Publications
- Monthly Business Survey – Start of May 2...
The Banque de France publishes a range of monthly and quarterly economic surveys that provide a snapshot of the French economy in the form of business climate indicators and short-term forecasts.
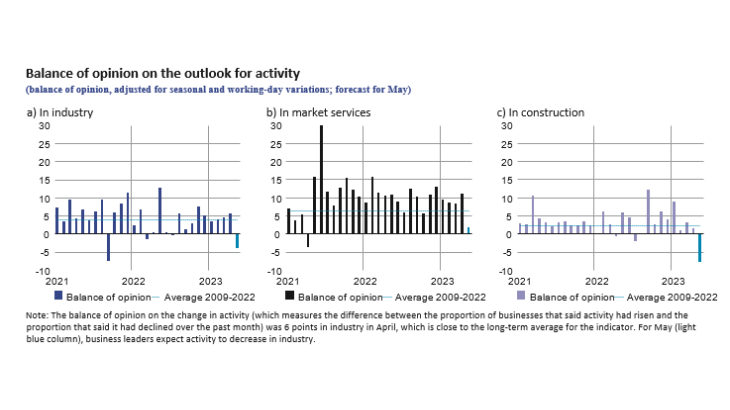
According to the business leaders surveyed (approximately 8,500 companies and establishments questioned between 26 April and 4 May), activity increased in April in industry, services and construction. For May, business leaders expect activity to stabilise in services and to decline in industry and construction. However, these expectations may reflect at least in part the effect of a higher than usual number of holidays in May.
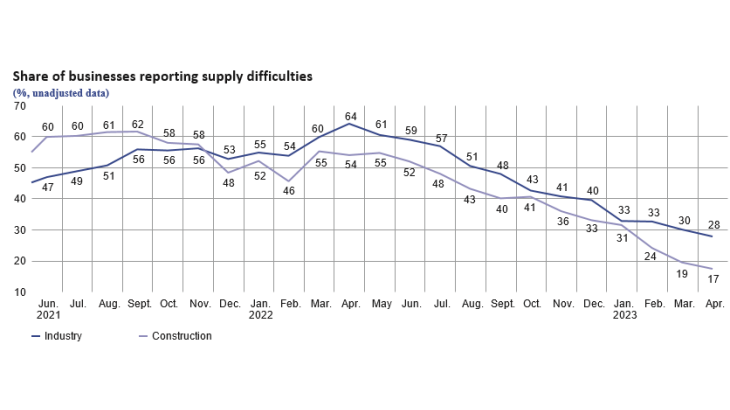
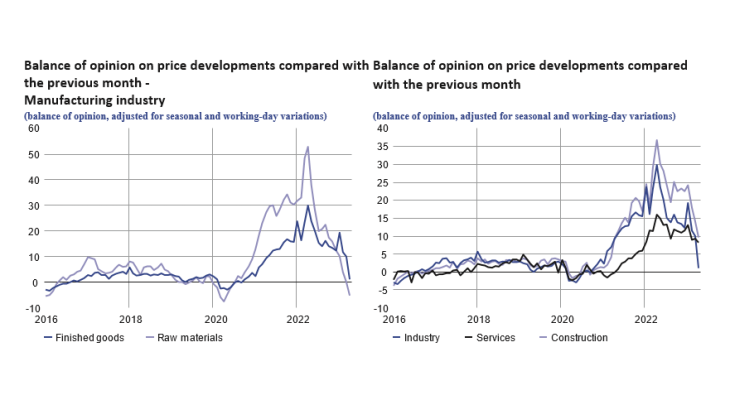
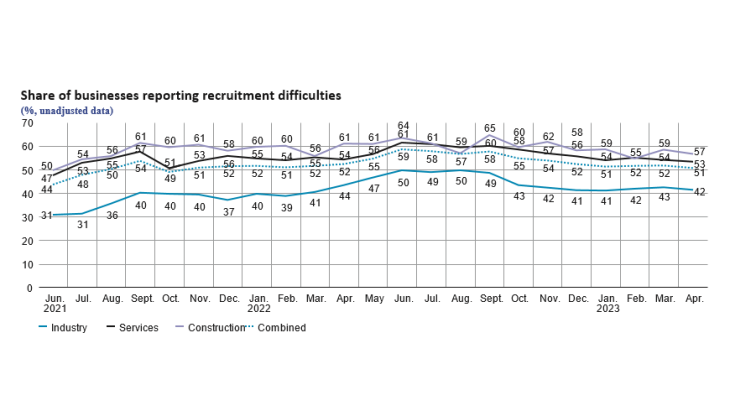
Supply difficulties continued to ease in construction (17% of companies reported difficulties in April, after 19% in March) and in industry (28% of business leaders reported difficulties, down from 30% in March). Above all, for the first time since the summer of 2020, manufacturers indicated a decline in raw material prices and a levelling-off of finished products prices. Recruitment difficulties decreased slightly but concerned about half of businesses (51%).
Our uncertainty indicator decreased slightly in the three major sectors compared to the previous month, but remained high compared with pre-2020 levels. Cash positions hardly changed in industry and improved in services.
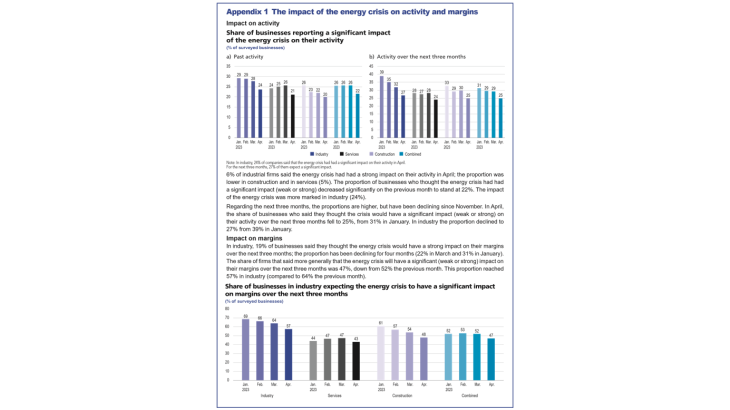
As regards the consequences of the energy crisis, business leaders’ opinions improved significantly, with 25% indicating that it would affect their activity over the next three months (after 29% in March and 31% in January).
Based on the survey results, as well as other indicators, we estimate that GDP growth in the second quarter of 2023 should be slightly positive compared to the previous quarter.
1. In April, activity continued to increase in industry, services and construction
In April, activity increased in industry, at a pace in line with the expectations expressed by business leaders last month. Balances of opinion indicate that production rose in most sectors. The increase was particularly strong in chemicals and pharmaceuticals, as well as in aeronautics and computer, electronic and optical products. In the automotive and rubber and plastic products sectors, production dipped slightly.
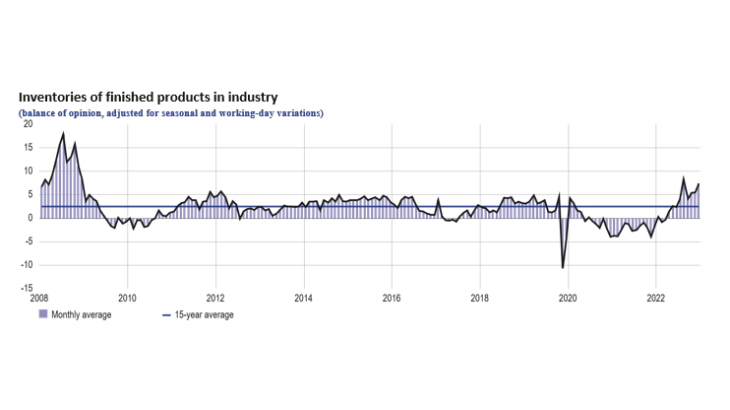
Inventories of finished goods increased in April. They were deemed to be above their long-term average, particularly in computer, electronic and optical products, electrical equipment, chemicals and the automotive industry. Conversely, in the pharmaceutical industry, inventories were deemed to be significantly lower than usual.
In market services, activity continued to expand at a sustained rate. This rise was particularly robust in car repair services, publishing, accommodation, leisure activities and personal services. Conversely, activity contracted sharply in temporary work, as well as in transportation and storage.
Activity hardly improved in construction: it remained more dynamic in finishing works than what business leaders had anticipated in last month’s survey; on the other hand, it fell significantly in structural works, in line with business leaders’ expectations.
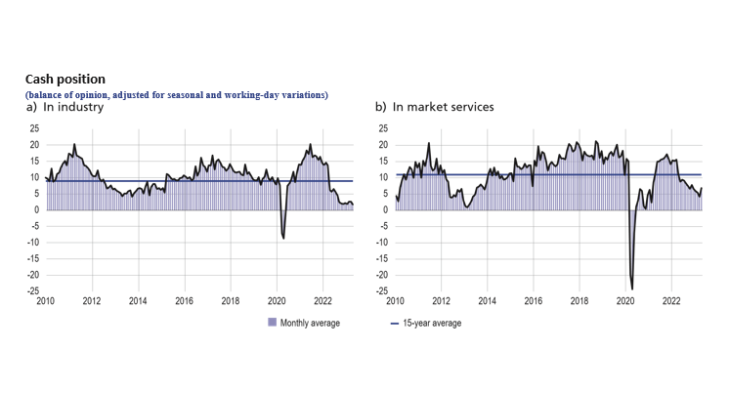
The balance of opinion on cash positions hardly changed in industry, and remained below its long-term average. It picked up in services in April, particularly in food services, technical services and advertising and market research.
2. In May, business leaders expect activity to decline in industry and construction and to stabilise in services
In May, and for the first time since last summer, business leaders in industry expect activity to decline in most sectors, which may reflect, at least in part, the effect of a higher than usual number of holidays taken by employees in this sector (even after adjusting for working day and seasonal variations). Decreases in activity are expected in particular in metal and metal products manufacturing, rubber and plastics and electrical equipment. In contrast, growth in computer, electronic and optical products is expected to remain high.
In services, activity is expected to increase little, due to contrasting sectoral dynamics. Thus, in automobile repair, transportation and storage, and temporary work, business leaders expect activity to decline. In the other sectors, they expect an increase in activity, particularly in accommodation and food services as well as in car rental services, management consultancy and publishing.
Lastly, in construction, business leaders expect activity to fall in both structural and finishing works.
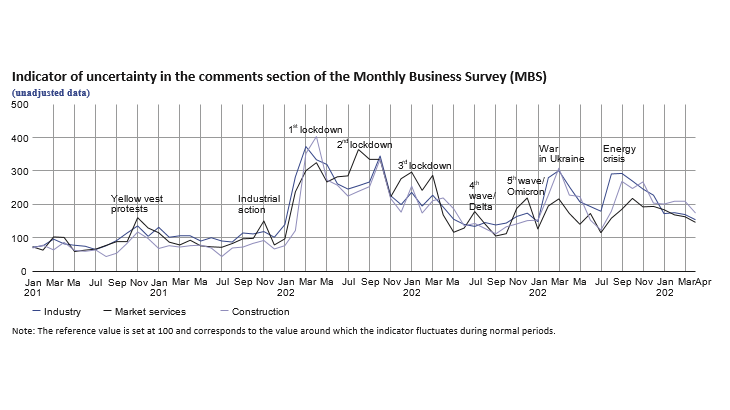
Our monthly uncertainty indicator, which is constructed from a textual analysis of comments made by the respondent companies, decreased slightly in April. However, it remained above its pre-Covid average level.
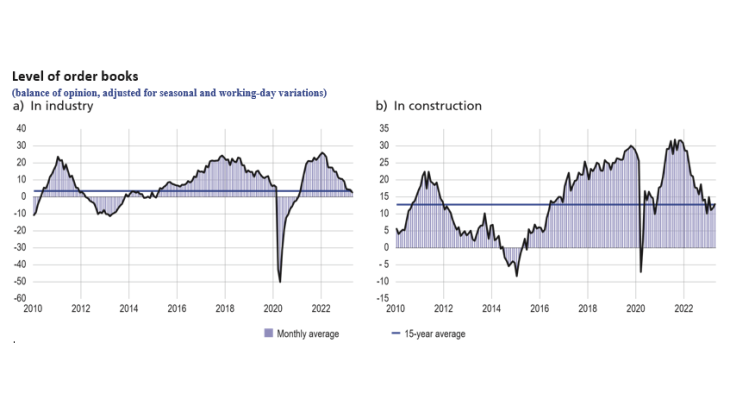
In industry, the balance of opinion on order books fell to below its fifteen-year average, albeit with a strong polarisation between sectors where order books were deemed to be well-stocked (automotive industry, aeronautics, computer, electronic and optical products, metal and metal products manufacturing) and those where they were deemed to be low (agri-food, chemicals, wood, paper and printing, rubber and plastic products). In construction, order books increased for the second month in a row, thanks to a revival of orders in finishing works.
3. Supply difficulties continued to subside; the pace of price increases slowed sharply in industry and construction
In April, supply difficulties continued to subside in industry (affecting 28% of businesses, after 30% in March) and in construction (17%, after 19%).
For the first time since the summer of 2020, the balance of opinion on raw material prices turned negative in industry, while the balance of opinion on finished products prices fell sharply, which indicates that the pace of price increases was once again similar to that of the pre-Covid period. In construction, prices slowed markedly, with competition intensifying in a context of anticipated lower activity. In services, the slowdown in prices was more gradual.
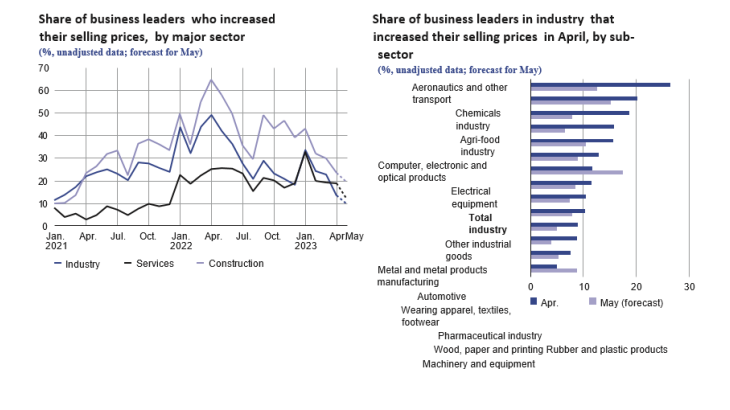
More specifically, 13% of business leaders said they raised their selling prices in industry in April (compared with 49% in April 2022). This proportion is the lowest for a month of April since 2019 (except for 2020). In the agri-food sector, it reached 19% (compared with 53% in April 2022), which is close to the expectations expressed by business leaders last month (14%). In construction, 23% of businesses raised their prices in April (65% in April 2022). In services, the proportion dropped to 19%, compared with 29% in April 2022. The overall outlook for May suggests further easing in industry (9%), market services (12%), and construction (19%).
Business leaders were also asked about their recruitment difficulties. These difficulties decreased slightly in April and concerned 51% of the businesses questioned in all sectors.
4. Our estimates point to a slight increase in GDP in the second quarter
In our previous business survey, published on 11 April 2023, we correctly anticipated the evolution of activity in the first quarter, as the quarterly accounts published by Insee at the end of April indicated a GDP growth of 0.2%. Despite a downturn in the construction sector, activity was resilient in the past quarter, particularly in industry, driven up by the energy component, while market services remained stable compared to the fourth quarter of 2022.
For the month of April, the use of survey information at a fine level of disaggregation, as well as other available data, leads us to estimate that GDP is expected to increase compared to March, which recorded a monthly low. This is mainly due to an upturn in activity in industry and market services, with a strong rebound in the sectors affected by the strikes in March, in particular transport services and energy.
More specifically, according to the survey data, value added is expected to rise in the manufacturing industry and remain stable in the agri-food industry. The energy sector (not covered by the survey) is the main driver of value added growth in industry, which picked up after a lacklustre month of March. The value added in the services covered by the survey is also expected to increase in April, in household services, accommodation and food services and business services. Finally, construction is expected to rise slightly in April.
The high-frequency data that we monitor in parallel for those services excluded from or only partially covered by the survey suggest that value added dropped slightly in the trade sectors, whereas it rebounded in transport services (in particular those affected by the industrial action).
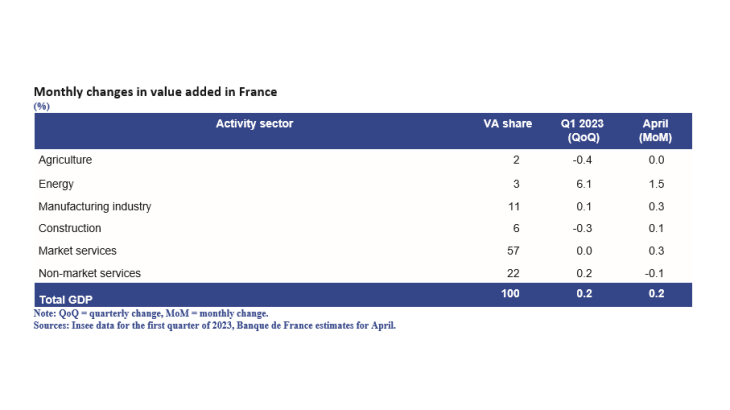
Business leaders’ forecasts for May indicate that GDP will increase moderately compared to April, with again contrasting performances across sectors and a degree of uncertainty which is still rather high.
For the second quarter of 2023 as a whole, we estimate that GDP will be slightly up on the previous quarter.
Download the PDF version of this article
Updated on the 25th of July 2024