1. Marked macroeconomic changes over the past twenty years
A slowdown in growth
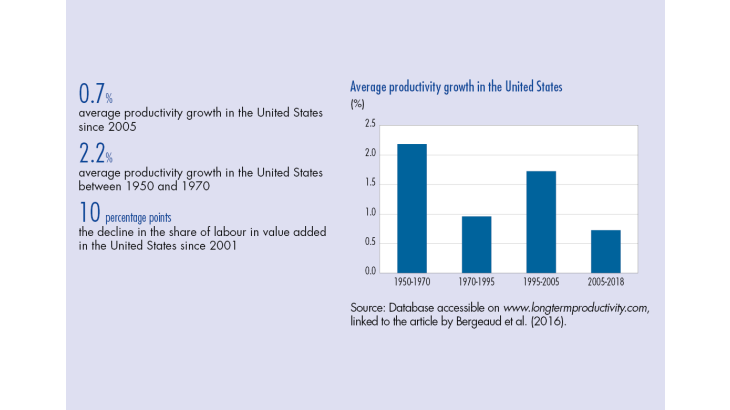
Economic growth has seen a significant downward trend since the 1970s in most Organisation for Economic Co-operation and Development (OECD) economies. Apart from the United States during the short period between 1995 and 2004, the GDP per capita of advanced countries has slowed, affected by the sharp decline in productivity growth, as shown in Chart 1. Over the most recent period, annual GDP per capita growth has been below 1% per year in the euro area and only slightly higher in the United States, whereas it has averaged 2% since the end of the 19th century (see Bergeaud et al., 2014 and 2016).
As Fernald et al. (2017) demonstrated, this slowdown precedes the 2008 crisis and is therefore not just a temporary consequence of it. Nor does it appear to be a statistical artefact related to GDP measurement errors as posited by Syverson (2017) and as quantified in particular by Aghion et al. (2018a and 2019a) as well as Byrne et al. (2016). On the contrary, this slowdown seems to be structural in origin and is the focus of recent debates on the future growth outlook that can reasonably be expected in the more or less long term (see in particular Cette et al., 2016).
A decline in the share of labour in the United States
There are many possible explanations for the slowdown in productivity. In this article, we focus in particular on the fact that in the United States, this has been accompanied by a decline in the share of labour in value added, measured in national accounts by the ratio of the sum of wages to the sum of value added. This result is especially surprising given that the stability of this share over time, around two-thirds, is one of the stylised facts of economic growth described by Kaldor (1957). Chart 2 illustrates this phenomenon using official data from the Bureau of Labor Statistics (BLS) since 1947. Indeed, we observe a relative stability until the end of the 1990s, followed by a net decrease of about six percentage points concentrated over the following decade.
[To read more, please download the article]
