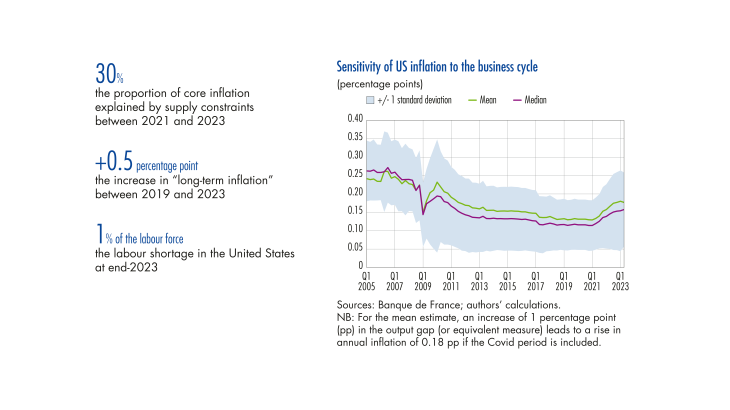
The ten years preceding the pandemic saw low inflation volatility in the advanced countries, particularly the United States. This period prompted a number of academic studies on the flattening of the Phillips curve (which describes the positive relationship between actual inflation and past economic activity). Some have gone so far as to claim that this relationship no longer exists (the “dead Phillips curve” – see Ratner and Sim, 2022). The sharp rise and persistence of inflation post Covid has called into question previous analyses, raising the issue of whether recent trends are structural or temporary. This article looks at the dynamics of inflation and its potential determinants. It also sets out some aspects of the debate surrounding the Phillips curve, illustrating them with estimates.
1 Highly unsettled US inflation dynamics after the pandemic
Asynchronous dynamics in the prices of goods and services
In the year and a half following the pandemic, US inflation soared. Measured by the consumer price index (CPI), it rose from 1.3% to 9% between December 2020 and June 2022. This 7.7 percentage point (pp) increase was accompanied by a 5 pp rise in core inflation, which reached 6.3% (see Chart 1a). Since then, both headline and core inflation have fallen, to 3.4% and 3.9% respectively in December 2023.
Post Covid, goods inflation rose faster than services inflation, due to supply chain disruptions in the goods sector (and their impact on symptomatic segments such as the used car market) and the distortion of consumption in favour of goods. Inflation in services then followed, pushing up core inflation (see Chart 1b) and doing so more persistently. In 2023, the dynamics reversed: goods inflation fell back to 0% by the end of 2023, due to the end of supply chain problems, but services inflation persisted at 5.3%, partly due to rents. Excluding rents, services inflation fell back to 3.4% by December, 1.3 pp above its pre Covid 2010 19 average.
The much debated causes of inflation: between supply and demand factors and pressures on the labour market
A study by Bernanke and Blanchard (2023) concludes that the post Covid surge in inflation (between the third quarter of 2020 and the second quarter of 2022) was primarily the result of shocks to the goods market rather than pressures on the labour market. …
