This paper presents the long-run evolution of pretax national income inequality over the 1900-2014 period. The major long-run transformation is the rise of the share going to the bottom 50% (the “lower class”) and the middle 40% (the “middle class”) and the decline of the share going to the top 10% (the “upper class”). Regarding the recent trend, the top 10% income share declined somewhat after the 2008 financial crises, but still significantly higher than in the early 1980s. Most importantly, the top 1% income share significantly increases between 1983 and 2007: it rose from less than 8% of total income to over 12% over this period, i.e. by more than 50%. This is less massive than in the U.S., but still fairly spectacular. Moreover, the higher we go at the top of the distribution, the higher the rise in top income shares which is due both to the rise of very top labor incomes and very top capital incomes.
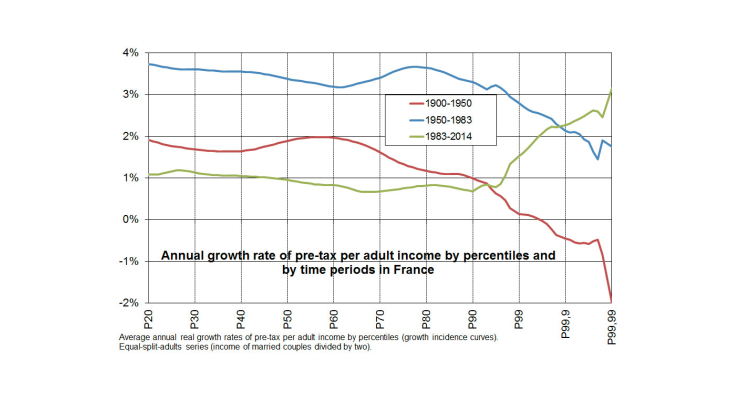
Between 1983 and 2014, average per adult national income rose by 35% in real terms in France. However actual cumulated growth was not the same for all income groups: cumulated growth between 1983 and 2014 was 30% on average for the bottom 50% of the distribution, 27% for next 40%, and 50% for the top 10%. Most importantly, cumulated growth remains below average until the 95th percentile, and then rises steeply, up to as much as 100% for the top 1% and 160% for the top 0.01%. The contrast with the 1950-1983 period is particularly striking. In effect, during the “Thirty Glorious Years”, we observe the exact opposite pattern as in the following thirty years. Between 1950 and 1983, growth rates were very high for the bottom 95% of the population (about 3.5% per year, see Figure) and fell abruptly above the 95th percentile (1.8% at the very top); between 1983 and 2014, growth rates were modest for the bottom 95% of the population (about 1% per year) and rose sharply above the 95th percentile (3% at the very top).
How can we account for this complete reversal between the 1950-1983 and 1983-2014 sub-periods? Our series show that the sharp rise of very top incomes since the 1980s is due both to top capital incomes and top labor incomes. Regarding the rise of top capital incomes, one should distinguish between two effects: the rise of the macroeconomic capital share (an evolution that is due to a combination of economic and institutional factors, including the decline of labor bargaining power and the lift of rent control, and that was reinforced by corporate privatization policies), and the rise of wealth concentration.
We also document the changing correlation between wealth and labor income, showing that it has become increasingly difficult in recent decades to access top wealth groups with labor income only. Next, our breakdowns by age and gender allow us to explore new dimensions of inequality dynamics together with the top income dimension. For instance, we find that gender inequality in labor income declined in recent decades, albeit fairly slowly among top labor incomes. E.g. female share among top 0.1% earners was only 12% in 2012 (vs. 7% in 1994 and 5% in 1970). Finally, since our new series are anchored to national accounts, they allow for more reliable comparisons across countries. We find that average pre-tax income among bottom 50% adults is 30% larger in France than in the U.S., in spite of the fact that aggregate per adult national income is 30% smaller in France. Post-tax comparisons are likely to exacerbate this conclusion.
