Eco Notepad

The impact of multinationals’ transfers on Irish GDP

Published on 3 February 2021
Authors : Jérémi Montornès, Marie-Baïanne Khder

Billet n°202. The authors belonged to the Economic Studies and National Accounts Directorate at Insee when they wrote the article from which this blog post is derived. The authors would like to thank D. Blanchet for his helpful comments when writing the article. They remain solely responsible for any errors and omissions. Irish GDP growth over the recent period has been strongly influenced by transfers from US multinationals. These transactions have increased since 2015. Changes in Irish GDP and its components now reflect multinationals’ choice of location in addition to cyclical fluctuations.

Image Quarterly changes in GDP and GNI in volume (in %, adjusted for seasonal and working day variations)
Chart 1: Quarterly changes in GDP and GNI in volume (in %, adjusted for seasonal and working day variations)
Source: Central Statistics Office (CSO), national accounts

Note: GNI is equal to GDP plus primary income flows (e.g. wages, property income) received from abroad and minus primary income flows paid abroad. The strong GDP growth in Q3 2020 is attributable to the exit from lockdown following the first wave of the health crisis.

The growth of Irish Gross Domestic Product (GDP) is the subject of much debate and particular attention among international organisations (Eurostat, OECD). Since 2015 (see Chart 1), quarterly growth has stood above 2.5% for eight quarters, a threshold almost twice as high as the average quarterly growth observed between 1995 and 2014. Since 1995, this threshold has been exceeded on several occasions thanks to the Ireland’s economic catch-up process and the establishment of multinationals in Ireland. What is new in the post-2015 period is the frequency and extent to which this threshold has been exceeded. These episodes are related to the relocation of sales proceeds or assets by multinationals to their Irish subsidiaries. These relocation operations are taken into account in the calculation of GDP through two channels: (i) mainly through contract manufacturing agreements which add to "physical" exports the proceeds of sales of goods and services produced abroad but owned by Irish resident units (ii) through gross fixed capital formation (GFCF) and imports of research and development (R&D) services. The magnitude of the changes in Irish GDP and its components affects euro area aggregates even though Ireland accounted for 3% of euro area GDP (in 2020). Thus, in Q2 2019, Ireland's contribution to euro area GDP amounted to 0.1 point, i.e. half of quarterly growth.

The concept of Gross National Income (GNI) is used to adjust for some of the effects of income transfers with the rest of the world. While GDP includes the income generated in Ireland but paid to non-resident agents, GNI measures the total income of agents resident in Ireland only. Although the inflows and outflows of income associated with foreign multinationals are deducted from GDP from its computation, GNI also shows a volatile pattern due to the treatment of reinvested earnings in Irish subsidiaries, i.e. the difference between the profits earned by subsidiaries in Ireland in a given year and the dividends paid to non-resident entities in that year. A large share of these reinvested earnings, which corresponds to the depreciation of intangible assets, remains within Irish resident units (Lane, 2017). In order to take account of this, the Central Statistics Office publishes annually a modified GNI, which corresponds to the GNI adjusted for, among other things, depreciation on R&D service imports.

The surge in Irish exports

The recent sharp growth in Irish GDP can mainly be explained by the increase in exports in national accounts. In Q1 2015, exports jumped by more than 60% (or EUR 18 billion). This movement continued after 2015 and increased (see the quarters marked by shaded areas in Chart 2) when economic ownership of production abroad was linked to Irish subsidiaries via contract manufacturing agreements. Contract manufacturing occurs in national accounts when an Irish company resorts to a company abroad to manufacture products on its behalf, but retains economic ownership of that production. It is not always easy to determine economic ownership in the sense of national accounts and in particular to distinguish it from legal ownership. With contract manufacturing, production is physically carried out abroad but is treated for accounting purposes as Irish production followed by export. Contract manufacturing is common in the electronics sector, where the clients simply provide the necessary inputs, e.g. for the production of smartphones, and the subcontractors produce the finished products. The increase in exports via contract manufacturing agreements does not therefore correspond to trade in goods that would physically cross the Irish border but to margins earned abroad and incorporated into Irish trade in goods.

This explains why most of the variation in exports in the national accounts stems from an increase in adjustments, which includes contract manufacturing agreements, made to customs statistics, which record only trade in goods "physically" crossing the Irish border (see the difference between the two curves in Chart 2).
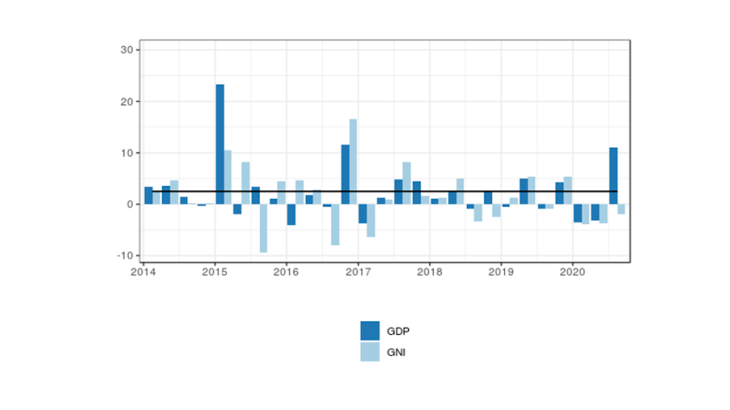
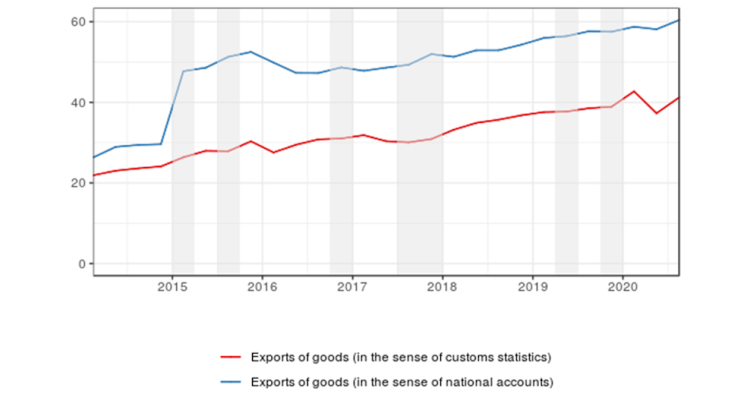
Image From customs data to national accounts (in EUR billions, adjusted for seasonal and working day variations)
Chart 2: From customs data to national accounts (in EUR billions, adjusted for seasonal and working day variations)

Note: shaded areas correspond to quarters of GDP growth above 2.5%.

Distortions on investment and imports

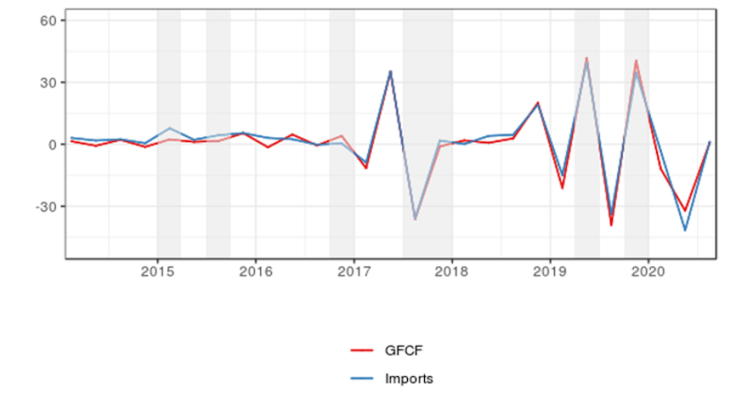
Another source of distortions in GDP components comes from transfers of intangible assets from multinationals to their Irish subsidiaries. In accounting terms, the Irish subsidiary acquires the entire transferred asset at the date of the transfer. This operation is recorded as gross fixed capital formation (GFCF). However, the asset transfer also translates into a concomitant import. These asset transfers are easily identifiable as they led to particularly significant increases in GFCF (up l00% or 200%) and imports (up 25% or 50%) in Q2 2017, Q4 2018, Q2 2019 and Q4 2019. When the evolution of investment and imports is simultaneous and on the same scale, the effect on GDP is generally almost nil, except in Q1 2015 as shown in Chart 3, which represents these variables in levels (an asset transfer of EUR 241.8 billion in 2015 was treated as a change in volume and not as an investment, see Table 1).

Image Quarterly evolution of GFCF and imports in volume (in EUR billions, adjusted for seasonal and working day variations
Chart 3: Quarterly evolution of GFCF and imports in volume (in EUR billions, adjusted for seasonal and working day variations)
Source: CSO, national accounts

Note: shaded areas correspond to quarters of GDP growth above 2.5%.

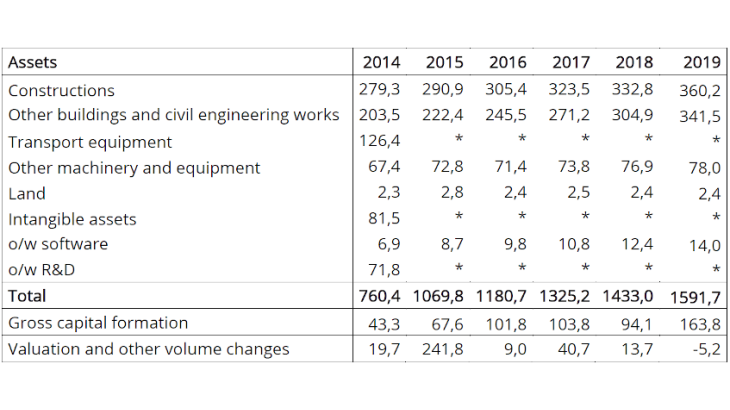
Since 2016, the amount of assets transferred has been entirely recorded as GFCF (use) and as matching imports (supply). These investment peaks are the accounting counterpart of the rise in the capital stock caused by the relocation of assets. The amount of annual GFCF has thus increased considerably compared to its pre-2015 level. The capital stock in Ireland more than doubled between 2014 and 2019. The detailed amounts by type of assets are not known for all categories due to the statistical secrecy that covers these operations involving only a few companies. It can be inferred that the largest increases are necessarily recorded for intangible assets and transport equipment marked with stars from 2015 in Table 1. Setser (201820192020) describes the tax avoidance strategies implemented by multinationals and traces the organisational change within multinationals in Ireland leading to these operations.

Image Capital stock by asset category (in EUR billions)
Table 1: Capital stock by asset category (in EUR billions)
Source: CSO, national accounts

Note: The change in assets from 2018 to 2019 (EUR 158.7 billion) is equal to GFCF (EUR 163.8 billion) + Valuation and other volume changes (-EUR 5.2 billion).

The recent dynamics of Irish GDP and the distortions in its components can mainly be explained by the relocation of sales proceeds and intangible assets by multinationals. These effects have been notable since 2015 due to the size of the Irish economy and, conversely, the large amounts of transactions involved. Changes in Irish GDP and its components now reflect multinationals’ choice of location in addition to cyclical fluctuations.

More generally, US multinationals’ transactions also generate current account surpluses in European financial centres (Belgium, Luxembourg, the Netherlands, Malta and Cyprus according to the approach of Di Nino et al., 2020) and give rise to statistical asymmetries between the euro area and the United States (Cezar and Le Gallo, 2019). In 2018, the euro area’s current account surplus amounted to EUR 131 billion according to the ECB, while it stood at EUR 40 billion according to the statistics of the Bureau of Economic Activities. National accounts standards need to be adjusted and revised in order to achieve a consistent recording of multinationals’ transactions, in particular by clarifying the concept of economic ownership of production and intellectual property products and facilitating its application (Khder, Montornès and Ragache, 2020).

Updated on 29 March 2024