Eco Notepad

How much do China’s regional lockdowns affect international trade?

Published on 2 December 2022
Authors : Sebastian Stumpner

Post n°293. As part of its zero-Covid policy, China uses regional lockdowns to limit the spread of the virus. This blog estimates the effect of these regional lockdowns on Chinese trade. While most lockdowns have no noticeable effect, lockdowns of very high stringency are continuing to depress trade. The particularly stringent Shanghai lockdown in April 2022 reduced aggregate Chinese trade by 3-4%.

Image Chart 1: Exports of Shanghai Province collapsed during the Shanghai Lockdown
Chart 1: Exports of Shanghai Province collapsed during the Shanghai Lockdown
Source: Banque de France.
Lockdown stringency index for the Shanghai Province taken from data by the University of Oxford. Data on exports (in USD) for the Shanghai Province provided by Trade Data Monitor (TDM).

While most countries have abandoned lockdowns as a policy to fight the spread of Covid-19, there is one notable and important exception -- China. Since the start of the pandemic, China has pursued a “zero-Covid” policy with the goal of achieving no new Covid infections. To that aim, it has developed a disease outbreak response system with mass testing, contact tracing, and -- if necessary -- local lockdowns. This blog explores the effect of these regional lockdowns on Chinese trade by combining province-level data on the timing and stringency of lockdowns with data on province-level international trade.

Chart 1 shows as an example changes in lockdown stringency (a measure from zero to one that captures the restrictiveness of lockdowns) and year-on-year export growth for the province of Shanghai. After initial cases were detected in early March 2022, the Shanghai authorities first responded with mobility restrictions and mass testing. Starting in early April, the entire city was placed under a particularly strict lockdown. Most schools and workplaces were closed (with the exception of necessary healthcare services), and residents were ordered to stay at home. Chart 1 shows that the Oxford stringency index rose sharply in April 2022, and year-on-year export growth of Shanghai province collapsed to -40%.

The Shanghai lockdown, however, is only one example of several regional lockdowns that Chinese authorities have implemented since mid-2020. It was also a particularly strict lockdown, as the monthly average of the Oxford stringency index for Shanghai in April 2022 rose to 0.94, far above that of any other province since the first wave. We use data from several regional lockdowns in China to estimate the effect of lockdowns on trade growth more systematically.

We study regional lockdowns that were implemented after the first wave, in order to focus on a time period in which lockdowns were not highly synchronised across Chinese provinces. This allows us to compare, at any point in time, the trade growth of provinces entering a lockdown (treated provinces) to those that were not (control provinces).

We start by defining regional lockdown “events” based on changes in provincial lockdown stringency. We collect data on monthly provincial lockdown stringency for China’s 31 provinces, and define a provincial lockdown as an increase in the local stringency measure of 0.2 point (on a scale from 0 to 1). Pooling data from mid-2020 to mid-2022, this defines nine provinces that experienced exactly one lockdown event and twenty control provinces without an event (two provinces with more than one event are excluded from the analysis).

The left panel of Chart 2 shows changes in stringency in treated vs control provinces, before and after a lockdown event. Prior to an event, lockdown stringency does not differ between provinces that are about to enter a lockdown and provinces that are not. As treated provinces enter a lockdown, their stringency level shoots up but reverts back to that of control provinces within 1-2 months.
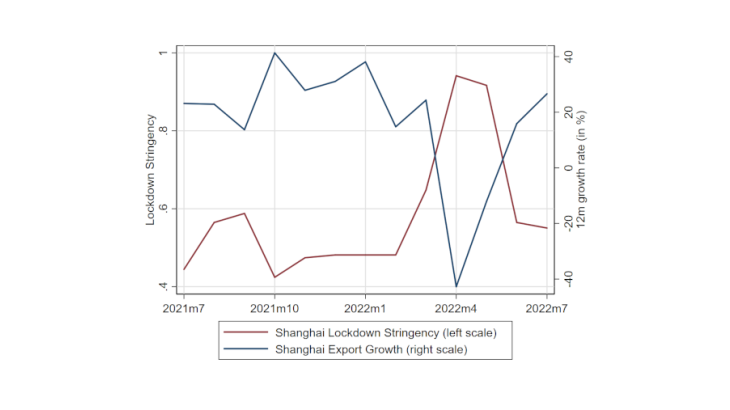
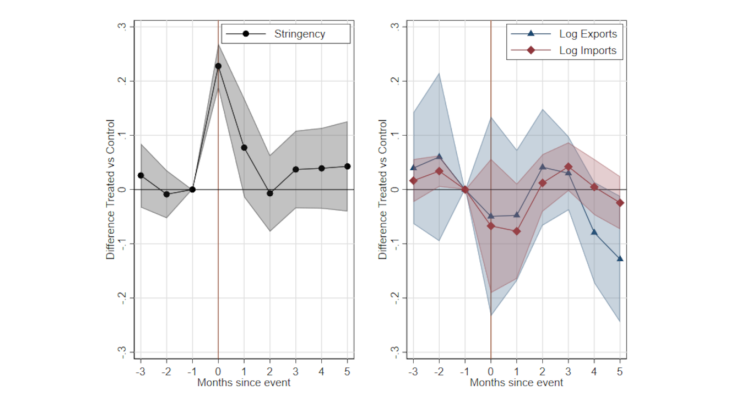
Image Chart 2: On average, provincial trade does not react much to a local lockdown
Chart 2: On average, provincial trade does not react much to a local lockdown
Source: Banque de France.
The left panel shows the average difference in stringency between treated and control provinces, at different times around the lockdown event. The right panel shows the estimated difference in log exports and log imports between treated and control provinces.

A challenge when comparing changes in exports (or imports) of different provinces is that provinces export different types of goods and trade with different partner countries. To control for changes in exports linked to these compositional differences, we control in our estimation for detailed product-by-destination specific shocks. That is, we compare export growth of, say, car parts to the US by a treated province to the export growth of car parts to the US by a control province, and we compute this difference at all dates around the lockdown event. The point estimates in the right panel of Chart 2 show the estimated difference of export (and import) growth between treated and control provinces, after netting out these compositional effects.

Somewhat surprisingly, there is no clear effect of lockdowns on both exports and imports (Chart 2, right panel). Exports and imports fall slightly at the time of the lockdown, but these effects are not different from zero in a statistically significant way. A possible explanation for this result is that most lockdowns remained at medium levels of stringency and used restrictions that firms and consumers had already learned to adapt to in the past. Nevertheless, the results seem to be at odds with evidence from Chart 1, showing a clear negative effect on exports of Shanghai.

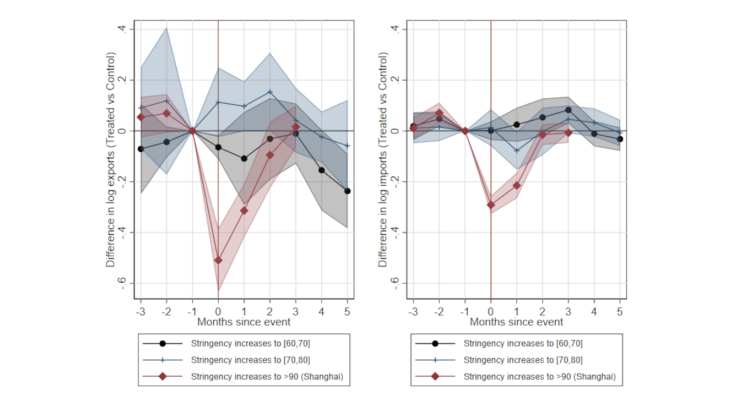
To reconcile these findings, we split up the nine treated provinces further into three groups: Provinces that increased stringency, but remained at medium levels (four provinces, in between 0.6 and 0.7 on the stringency scale after the lockdown event); provinces that came in at medium to high levels (four provinces, 0.7-0.8 on the stringency scale); and finally Shanghai that implemented a particularly strict lockdown of > 0.9 on the stringency scale.

Image Chart 3: Only the Shanghai lockdown of April 2022 significantly affected Chinese trade
Chart 3: Only the Shanghai lockdown of April 2022 significantly affected Chinese trade
Source: Banque de France.
Effect of lockdown on log exports (left panel) and log imports (right panel). Treated provinces are split into three groups depending on maximum lockdown stringency, and the effect is estimated separately for each of the three groups.

Chart 3 shows the estimated effect for exports (left panel) and imports (right panel). Only the Shanghai lockdown (red lines) significantly affected province-level trade, while the effect of other lockdowns has been close to zero. Given the economic importance of the Shanghai Province (8% of Chinese exports, and 14% of Chinese imports), this has also affected aggregate Chinese trade. Assuming in a back-of-the-envelope calculation that the lockdown in Shanghai has only affected trade of the Shanghai Province, but not that of other provinces, we compute that the Shanghai lockdown reduced aggregate Chinese exports in April 2022 by 3.2% and aggregate Chinese imports by 3.5%. Our analysis therefore suggests that Chinese regional lockdowns can still reduce aggregate trade, but only if they are exceptionally stringent and are implemented in an economically important province such as Shanghai.

The structure of Shanghai trade also plays an important role in aggregate Chinese exports. China is a major provider of capital and intermediate goods to the rest of the world (73% of all Chinese exports are capital or intermediate goods), and in Shanghai in particular the share of capital and intermediate goods exports is high (83%). Hence, the Shanghai lockdown may have also affected the trade of other countries further down in the value chain. This effect may have been particularly important for Japan and the United States, which together purchase over 30% of all goods exported by Shanghai (compared to 22% of aggregate Chinese goods exports).

Updated on 25 July 2024