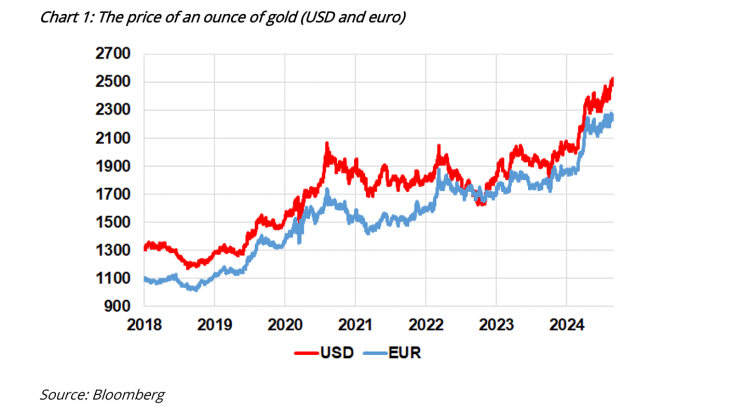
Post No.365. The price of gold has doubled since 2019, with a notable acceleration in its increase in 2023 (see Chart 1). This rise is unexpected, given that rising real interest rates, a slowdown in inflation and a strong dollar should have dragged the price down. Purchases of gold by emerging market central banks and individual investors have bolstered demand, explaining the price increase, against a backdrop of high and persistent geopolitical tensions.

Note: The surge in the price of gold over the period is relatively similar whether it is denominated in euro or dollars. On 29 August 2024, an ounce of gold was worth USD 2,503 or EUR 2,265.
The price of gold is mainly determined by fluctuations in demand
Gold is both a commodity and a financial asset whose price is determined by supply and demand: supply depends on the volume of production and recycling, while demand is contingent on the demand for physical gold (jewellery and technology) and financial gold, which is a function of investor appetite for gold over other assets.
- Supply is mainly split between mining production (75% of supply in 2023, source: World Gold Council) and recycling (25%). Mining production is relatively constant from one year to the next, and the cost of producing an ounce of gold is estimated at USD 1,300, which is the de facto floor price for gold. The share of recycling is increasing (up 9% in 2023), boosted by rising prices, but remains modest.
- Demand is mainly driven by the jewellery sector (49%), followed by central banks (23%), financial investors (21%) and the electronics sector (7%) – which relies on gold as a key input. China and India account for the bulk of jewellery demand (57%), with America and Europe playing a more marginal role (i.e. 21% combined).
Overall trends in these components of supply and demand have been relatively stable since 2018 (with the exception of 2020, due to the negative demand shock resulting from the pandemic). Supply is increasing slowly, mainly thanks to the build-up in gold recycling while the growth in demand is mainly attributable to emerging market central banks.
The price of gold is a function of US interest rates and inflation, as well as risk aversion
Gold is a non-yielding asset, unlike equities (dividends) and bonds (interest), and has no counterparty risk (i.e. there is no risk of issuer default when gold is physically held); its price is a function of several factors.
Bullish demand factors:
a. When geopolitical risks increase (as is currently the case with the war in Ukraine and tensions in the Middle East), and more generally when risk aversion increases in the financial markets, gold is much sought after.
b. Gold is generally seen as a hedge against inflation risk, although it is only an imperfect hedge in reality. While the correlation between the price of gold and inflation was sometimes positive from the mid-1970s through to the end of the 1980s, it was nil or even negative in the 1990s and 2000s, in a context of global disinflation. The correlation between the price of gold and the general level of prices is only really apparent over the long term (10-15 years). Nevertheless, in the short term, a resurgence of inflationary fears or of inflation itself generally triggers an increase in the price of gold.
c. The impact of these two factors is amplified by the increasing popularity of gold-backed financial products, such as certain exchange-traded funds (ETFs), which have made it easier for both retail and institutional investors to access gold. This consequently increased demand for physical gold (as these ETFs are backed by gold stocks), thereby driving up the price.
d. Purchases by emerging economy central banks, reflecting a form of diversification away from dollar-denominated assets, either for macroeconomic or geopolitical reasons (‘dedollarisation’).
Bearish demand factors:
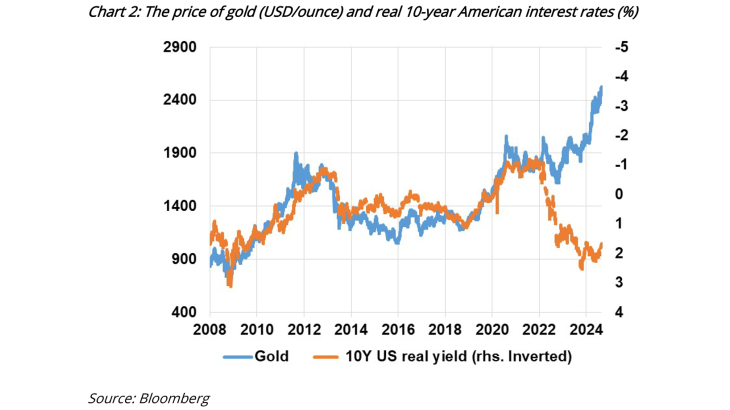
a. Higher real interest rates increase the opportunity cost of gold, which yields no return. As a result, during Fed tightening cycles, gold tends to depreciate in value, although this trend has not been apparent recently (see Chart 2).
b. A stronger dollar, which makes gold more expensive for buyers whose reference currency is not the dollar. A strong dollar also reflects confidence in the US economy, making gold less attractive as a secure asset.
c. Generally speaking, risk appetite is negatively correlated with gold, as investors favour exposure to risky assets such as equities and corporate bonds over defensive assets like cash, government bonds and gold.

Note: The traditional correlation between the price of gold in USD (blue) and US real interest rates (10-year US Treasury bond rates deflated by the underlying rate of inflation, orange) is true historically, however it has broken down since the start of the war in Ukraine (see below).
The increase in gold prices since 2021 appears to have been driven mainly by emerging market central bank buying
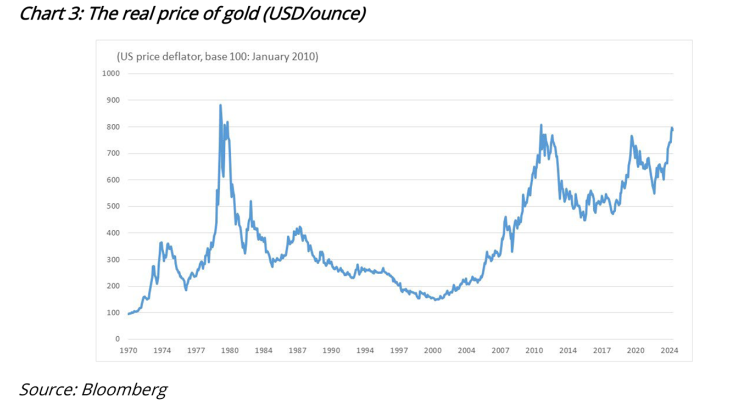
Between March and August 2024, gold broke its all-time record price in nominal terms every month, breaking the USD 2,500/ounce threshold in August. When adjusted for inflation, the gold price (see Chart 3) is close to the 1980 peak caused by the oil crisis inflationary shock, and the 2011 peak caused by the sovereign debt crisis in the euro area. It has already passed the peak caused by the 2020 pandemic-related shock.

Note: The real price of gold in USD per ounce corresponds to its nominal dollar price deflated by the US rate of inflation. Although it has still not exceeded its 1980 price, it is approaching this peak, which was driven by the strong inflationary pressure brought on by the second oil shock of 1979.
During the recent period, a number of factors traditionally favourable to a fall in the price of gold have come together:
- From 2022 on, the dollar strengthened as a result of the strong US recovery, which led to a sharp rise in inflation, forcing the Fed to act quickly to tighten its monetary policy.
- The Fed's tightening cycle has helped drive up real interest rates, which have been back in positive territory since mid-2023, but had previously been negative since 2019 (see Chart 2).
- While geopolitical risks have increased globally, risk aversion on the financial markets as measured by equity volatility is at a low point (with the exception of the volatility spike on 5 August 2024, which rapidly dissipated).
- Global outflows in ETFs invested in gold were trending downward in 2023 and through to May 2024.
Despite this context, the price of gold has risen sharply, invalidating the traditionally strong correlation between the price of gold and ETF outflows, or with US real interest rates since the start of the war in Ukraine (see Chart 3). This jump appears to be justified by investors buying for non-financial reasons, motivated by geopolitical tensions.
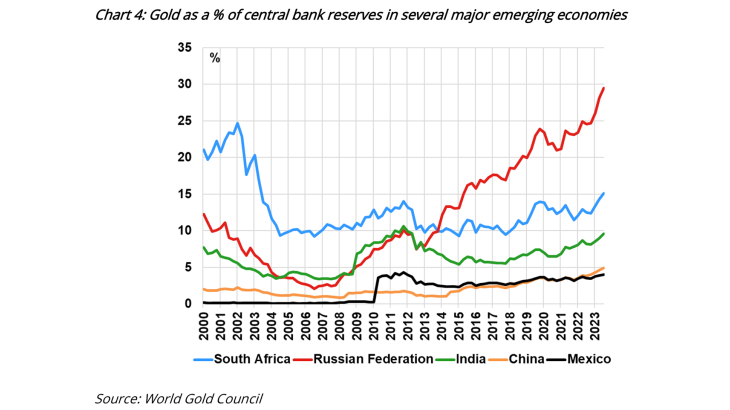
According to World Gold Council data, emerging market central banks, led by Russia and China, have been the principal buyers on the gold market (see Chart 4). Financial sanctions (often using the dollar as an instrument) and the resurgence of geopolitical tensions may encourage some emerging market central banks to diversify their foreign exchange reserves into gold and away from dollar-denominated assets. Although the dollar remains the dominant currency, its share in central bank reserves has fallen to 59%, a 25-year low (IMF). Overall, demand for gold from central banks has doubled over the last two years (from 30 March 2021 to 30 March 2023) compared with previous years, which has had a major impact on the price.
Moreover, since 2024, Chinese and Indian households have significantly increased their investment in gold excluding jewellery (by an additional 68% and 19%, respectively, between Q1 2023 and Q1 2024, according to WGC data), apparently to diversify their investments in the face of sharply declining property and equity markets in China and increased savings capacity in India.

Download the PDF version of the publication
Updated on the 21st of October 2024