- Home
- Publications et statistiques
- Publications
- Is the European Union really in surplus ...
Is the European Union really in surplus vis-à-vis the United States?
Post n°103. The European Union’s exchanges with the United States generate a significant trade surplus but are also characterised by a substantial foreign direct investment deficit. This deficit reflects certain choices made by multinational firms with regard to their activities’ locations, particularly the placing of US subsidiaries in Europe. We propose an interpretation of these transatlantic exchanges using an aggregate that is broader than the balance of goods and services alone.

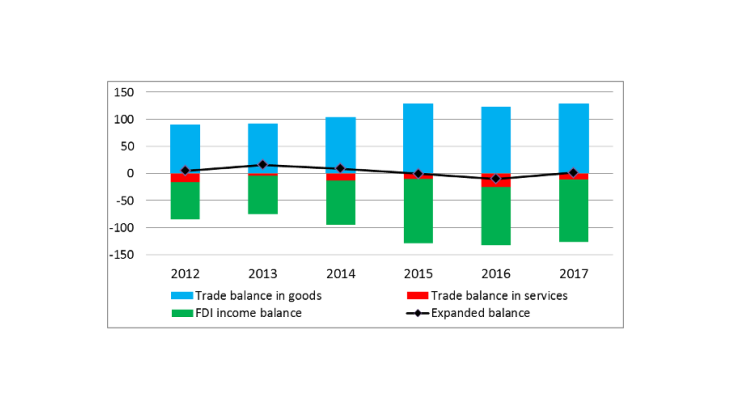
Key: Trade balance in goods and services expanded to include the EU’s foreign direct investment vis-à-vis the United States (EUR billions).
Measuring trade: a narrow or a broad aggregate?
Analysing trade relations between countries solely through the lens of the trade balance (goods and services) ignores some aspects of these exchanges, which nevertheless influences the current account balance. This is true for exchanges related to the different approaches to international expansion adopted by firms, particularly locating subsidiaries abroad, which generate economic spillover effects through income from foreign direct investment (FDI). Indeed, penetrating international markets comes down to a trade-off between exporting or producing and selling directly through a foreign facility (Helpman et al., 2004). In order to trade in certain services, such as the large retail sector, firms are obliged to set up abroad due to the nature of the production and marketing involved (Cezar & Fegar, 2018).
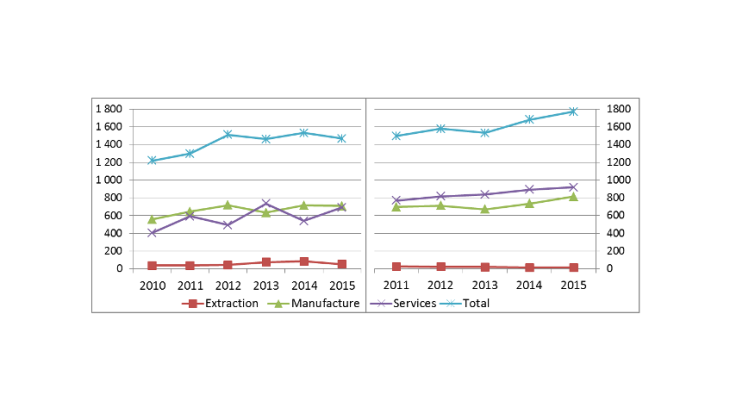
This pattern of internationalisation is far from negligible. Total turnover (excluding financial and insurance services) of US subsidiaries in the European Union amounted to EUR 1,770 billion in 2015, or 12% of EU GDP, while the equivalent figure for European subsidiaries in the United States came to EUR 1,468 billion (including financial and insurance services), or 9% of US GDP. Their presence contributes to the host country’s real activity and job creation. For example, the 24,700 US subsidiaries operating in the EU (down by 7% since 2010) employ 3.9 million people (up 13%). In turn, the 21,500 European subsidiaries established in the United States (up 21%) employ 2.9 million people, down by 13% since 2010 (Eurostat).

Note: The turnover of US subsidiaries in the EU does not include financial and insurance services.
The presence of subsidiaries abroad also has numerous consequences for their home economy, generating FDI flows in the balance of payments. In 2017, US subsidiaries in the EU produced FDI income of EUR 205 billion, while the EU subsidiaries generated EUR 94 billion – i.e. a deficit of EUR 111 billion for the EU. This deficit shows the predominance of this pattern of internationalisation for US firms, for example in the digital (Google, Apple, Facebook, Amazon, Microsoft – GAFAM) or transport (General Electric, Ford) sectors. Other factors, such as different tax optimisation strategies, also contribute (Vicard, 2015), as is particularly the case with GAFAM’s choices of location for intangible assets (patents, R&D, etc.). For example, whether an export of services or an FDI flow is recorded in the balance of payments data depends on the strategies implemented in terms of locating intellectual property rights in the United States or Europe. In either case, the impact on the current account balance remains the same, but the effect on the balance of trade in goods and services taken in isolation differs.
Major asymmetries between European and US data...
In principle, the European trade surplus should coincide with the US deficit. But according to the European Union’s statistical office (Eurostat), the EU runs a positive trade balance in goods and services vis-à-vis the United States of EUR 180 billion, whereas its US counterpart, the Bureau of Economic Analysis (BEA), puts the bilateral deficit at EUR 90 billion. Measures of foreign direct investment (FDI) income also reveal substantial asymmetries (Chart 3).

The differences between the two statistical bodies complicate efforts to interpret the trade they describe (EconPol, 2018). Here, we propose a hybrid measure with the aim of developing a more relevant analysis of economic relations.
...that should be restated to obtain a measure that more closely reflects economic reality
The asymmetries mainly arise from how the two bodies account for the organisation of multinational firms (Eurostat, 2017).
With regard to trade in goods, the asymmetries are residual and mainly arise from switching from customs data to balance of payments data. We favour the former, which are more consistent between the two bodies.
As for FDI flows, and also for financial services – which account for almost half of the asymmetries related to total service flows – the challenge is to identify the circuits put in place by multinational firms for organisational or tax purposes. Indeed, these multinationals may centralise their business activity for the entire Common Market in certain EU countries that thereby play a platform or intermediary role.
This situation is presented differently on either side of the Atlantic. Eurostat allocates the FDI income to the country of residence of the first counterparty, leading to an overestimation of some financial centres compared with the actual flows (Lane & Milesi-Ferretti, 2017). Conversely, the BEA applies an ultimate investing country principle (Central Statistics Office of Ireland), which involves allocating income to the firm initiating the investment (in our case, US firms) rather than to transit countries such as Ireland or Luxembourg. Equally, the BEA includes the Crown dependencies of Guernsey, Jersey and the Isle of Man – an important point of entry for financial flows into the EU – within the scope of the EU for its financial services data. Eurostat does not (BEA, 2018).
In both cases, we use data from the BEA as its methodology allows us to disentangle the financial structures that determine these flows and thus get closer to the economic reality. For the other flows, we use Eurostat data.
Overall, according to our measure, the balance of goods, services and FDI in 2017 came to EUR 129 billion, EUR -11 billion and EUR -116 billion, respectively (compared with Eurostat’s respectively EUR 165 billion, EUR 13 billion and EUR 0.5 billion and the BEA’s EUR 135 billion, EUR ‑45 billion and EUR -116 billion) (Charts 1 and 3).
After restatement, the trade balance in goods and services expanded to include FDI income is almost in equilibrium
The broader aggregate of trade in goods and services and FDI income flows (Cezar, 2017) allows us to take into account the different types of trade relations described above. Unlike a bilateral current account balance, it disregards portfolio investment income and secondary income, which do not participate in the same way in the production process as they are intended to meet financial rationales instead.
Our approach reveals an almost perfectly balanced economic relationship with a surplus for the EU of barely EUR 1.5 billion (whereas the European goods and services trade surplus amounted to EUR 117 billion in 2017). Net FDI inflows from the activity of US firms offset the US trade deficit (Chart 1).
This balance makes sense when it is calculated vis-à-vis the EU as a whole. Indeed, by locating a subsidiary in an EU Member State, the parent company benefits from the entire Common Market and European value chain. Furthermore, due to the existence of distinct tax rules, different optimisation principles come into play (Nayman & Vicard, 2018). Thus, certain subsidiary business activities targeting the EU generally are concentrated in a small number of countries, sometimes generating high FDI stocks and income (the Netherlands, Ireland and Luxembourg). In addition, choices of location (head offices, intangible assets) lead to implied yield spreads on US investments between Member States (Table 1).
Table 1: Stocks, income and yield of US direct investment in the European Union (2017, USD billions)
|
|
US FDI stocks |
FDI income |
Implied yield |
|
GERMANY |
136.1 |
6.2 |
5% |
|
SPAIN |
33.1 |
3.2 |
10% |
|
FRANCE |
85.6 |
3.0 |
4% |
|
IRELAND |
446.4 |
51.8 |
12% |
|
ITALY |
30.7 |
1.5 |
5% |
|
LUXEMBOURG |
676.4 |
36.8 |
5% |
|
NETHERLANDS |
936.7 |
76.1 |
8% |
|
UNITED KINGDOM |
747.6 |
41.3 |
6% |
|
EU28 TOTAL |
3,244.1 |
231.9 |
7% |
Sources: BEA and authors’ calculations.
Updated on the 25th of July 2024